
- Bitcoin’s price reached $80K before dipping, with analysts anticipating a bull run.
- RSI divergence suggests a possible trend reversal and rising buying pressure.
- The $94,500 resistance level may limit Bitcoin’s short-term price movements.
Bitcoin has recently been trading with varied market movements for a week now. Early today, BTC rebounded to its $80K level but later recorded a dip during the time of press. Despite the dips, many market analysts anticipate a bull impending movement.
Bitcoin Bullish Divergence on Sight
According to crypto analyst Crypto Rover, Price action indicates a downtrend, with lower lows forming in the market. However, the Relative Strength Index (RSI) displays a bullish divergence. The RSI shows higher lows, contrasting with the price action. This divergence is a technical indicator often associated with a potential price reversal. Bitcoin’s price recently tested support near $75,000, bouncing upward toward $80,000.
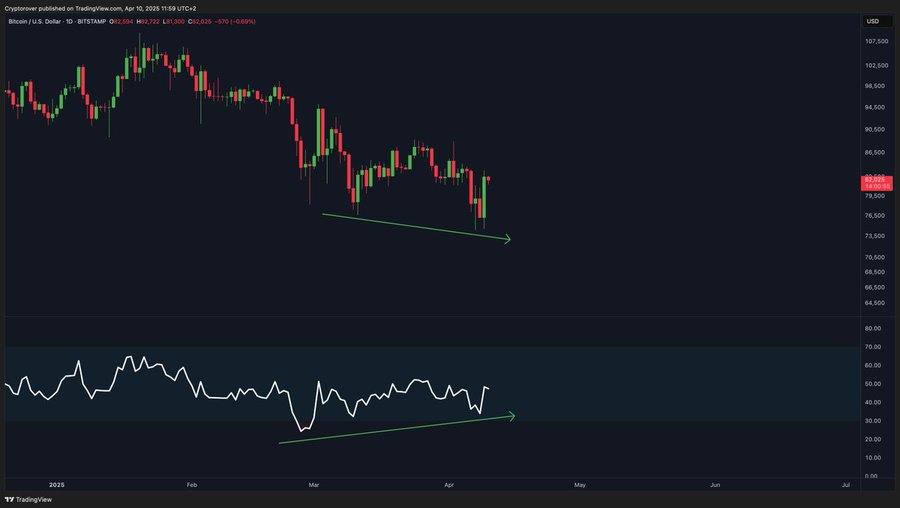
Additionally, the RSI reading supports the possibility of increasing buying pressure as the divergence strengthens. Market participants should observe if Bitcoin can maintain upward momentum or retest key support levels. The price range between $74,000 and $76,000 may act as critical support. This analysis suggests the price could continue upward if the RSI divergence confirms a trend reversal. Further movements depend on whether the upward momentum breaks above the $80,000 resistance level.
Bitcoin Halving Regression Rainbow Revealed
According to Mister Crypto, another trend is building for a big uptrend as the bull market unfolds, according to his 2012-2025 analysis. Each halving is represented by a circle. Bitcoin’s price goes up after each halving and each time follows the same path.
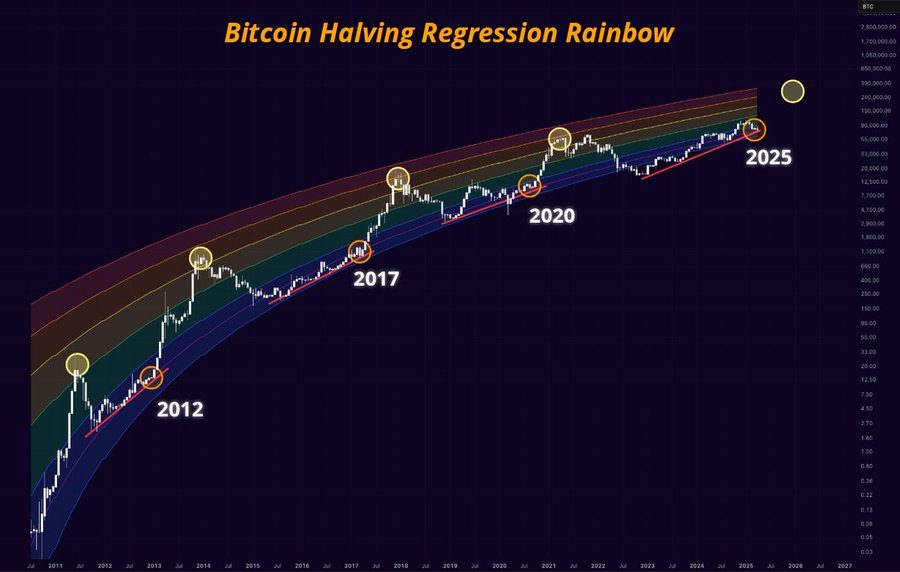
2012 Bitcoin broke out of a lower range, 2017 and 2020 halvings had similar trends as Bitcoin broke above key resistance. The chart says 2025 halving will trigger another price surge and Bitcoin will go above $100,000 based on the previous patterns.
Does Any Resistance Lie Ahead of the Market Performance?
According to Ali Chart observation based on the MVRV Extreme Deviation Pricing Bands there is a solid track of BTC’s price from December 2022 to April 2025, using various pricing bands to provide insight into market behavior. These bands include the BTC-MVRV ratio, the cumulative mean, and the cumulative standard deviation.
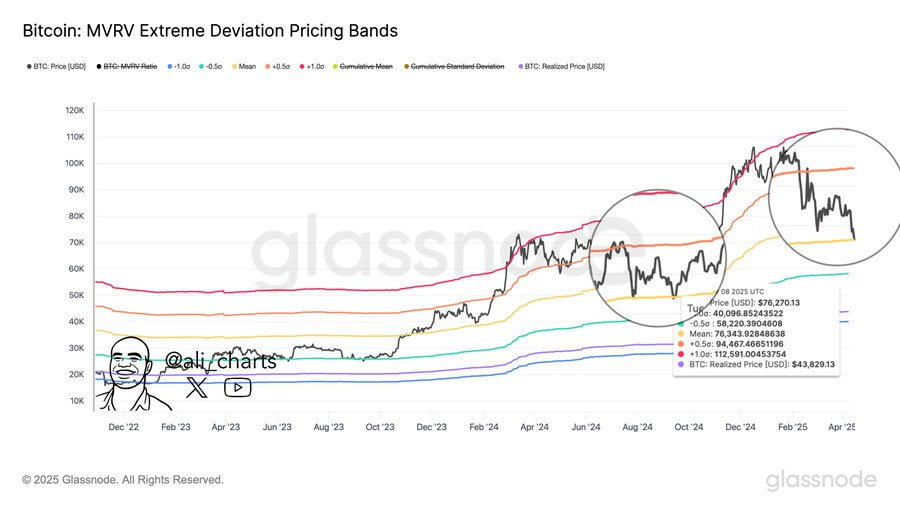
This price movement has oscillated as it has been traded between major levels of the market. Beginning at some $ 16,000 in December 2022, it was on the verge of touching $ 76,000 by the early part of the year 2025. The price has experienced a lot of fluctuation, and the closest to reaching the resistance level will be $94500, as shown by the Top red line in the chart. Therefore, the $94,500 price level becomes the key limit for BTC regarding the short-term outlook.
Bitcoin’s price at $79,740.51, down by 3.00% in the last 24 hours. The outstanding market capitalization totaled $1.58 trillion, down by 2.99%. 24-hour trading volume of Bitcoin is $50.09 billion; the volume to the market ratio is 3.38%. Currently, the total amount of BTC in circulation is 19.84 million BTC which is just a bit lower than the maximum limit of 21 million BTC. The most recent trends reveal the price ranging from $79, 480 to $ 82, 270, and therefore, it is showing a descending trend.


