
- PI broke above the trendline, now consolidating near the $0.60 support zone.
- RSI and MACD show early bullish signals after a long downtrend.
- The $0.546 level remains critical to hold as unlock pressure builds.
PI Network’s native token, PI, has surpassed the descending trendline with a break out and it is now eyeing a restest. This path has raised the question as to whether the new level will be defended despite the market is bringing more coins following the random unlocks that are taking place in the Pi ecosystem.
Key Support Level Under Scrutiny
Price action shows PI is holding above $0.546 following the breakout. This level is now seen as critical, as continued buyer interest at this range would confirm the trendline flip into support. Failure to maintain this level could place immediate pressure on bulls and expose the asset to further pullbacks.
According to an analysis by Trader Edge on Pi’s performance, a 6-hour chart notes a bull preparation movement. The PI Network 6-hour chart displays a consistent downtrend from mid-March, with prices falling below $0.80. A descending trendline capped multiple lower highs, reinforcing sustained bearish control for several weeks. The observation shows a breakdown near April 3, when the price dropped sharply below $0.50. Shortly after, a recovery candle pushed the price back to challenge the descending trendline.
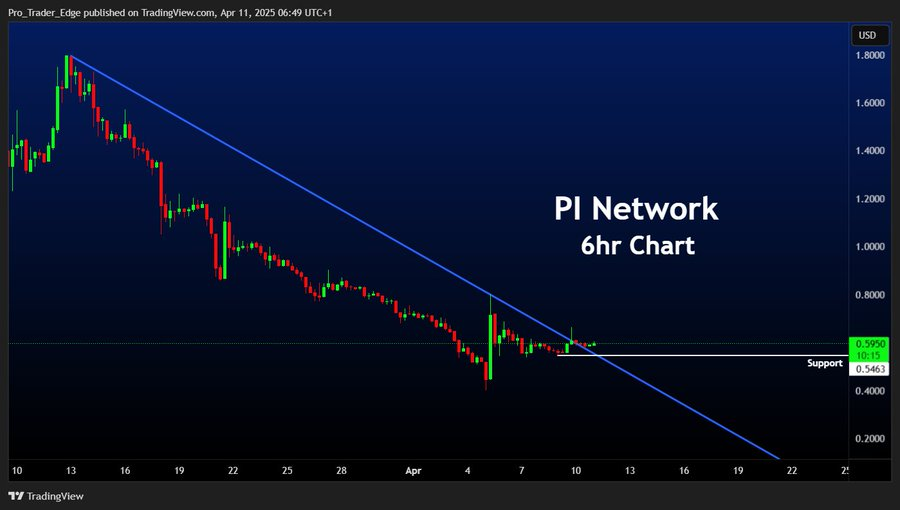
On April 10, the price broke above the trendline with a green candle, reaching near $0.60. A horizontal support zone is drawn at $0.5463, which acted as a recent pivot. Price is currently trading above this level, showing short-term consolidation near $0.5950. The market has tested the breakout zone multiple times without a reversal below support.
Technical Analysis and Current Market Action
Market analysts observe Pi trading at $0.6049 where it has achieved a 2.59% increase in its value during the previous 24 hours. The slight upward movement in Pi has occurred at the same time technical indicators indicate developing momentum potential. Currently, MACD (12, 26) displays a blue MACD line positioned at -0.1873 below an orange signal line at -0.2125.
This crossover, although still below the zero line, indicates weakening bearish momentum and a possible trend reversal if sustained. However, the Relative Strength Index (RSI 14) reads 37.66, rising from a previous low. The RSI value remains below the 50-neutral line but has broken its descending trendline, showing early signs of strength.
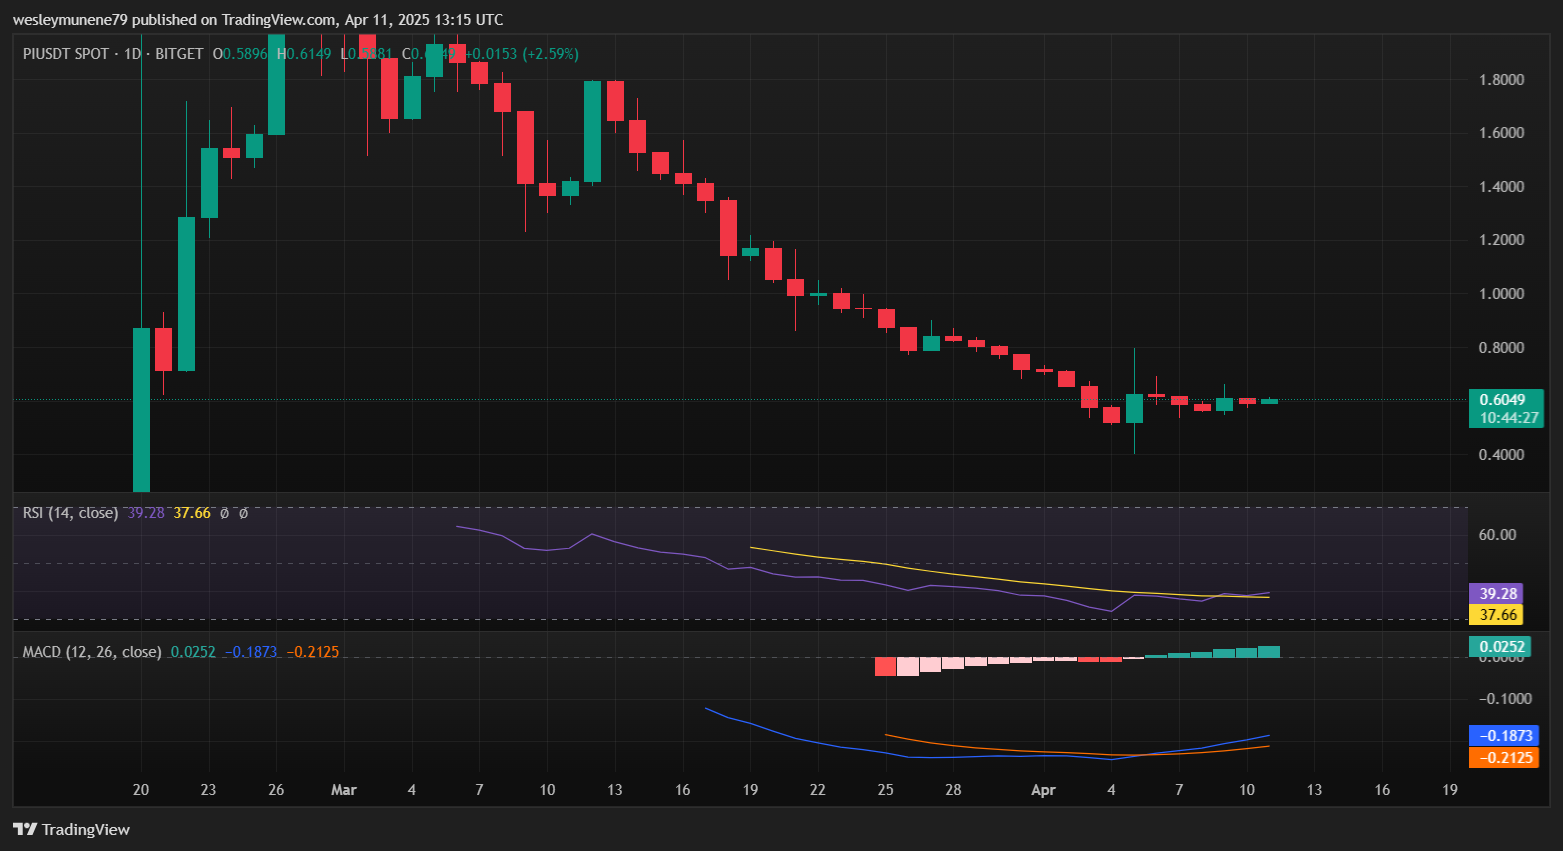
The RSI moving average stands at 39.28, slightly above the current RSI, suggesting a nearing crossover. These indicators reflect a market recovering from sustained selling pressure throughout March. Price action has moved sideways in April, holding above $0.58. The MACD’s upward turn and RSI’s recovery signal waning bearish control.
When the MACD line is above the signal line, this could be an indication that the bullish pressure is being strengthened if the histogram bars continue to expand. Likewise, if the RSI moves above the 40 level, this will also be an indication of upward strength for the RSI. The trend shows that short-term is unfolding from the oversold territories to neutral territory that holds above $0.58 at the time of this writing.


