
- MACD and RSI indicators show a potential reversal in Dogecoin’s price.
- A pullback is nearing its end, with a possible breakout ahead.
- Dogecoin’s market sentiment remains bearish, but a surge may follow soon.
Dogecoin (DOGE) has recently been showing signs of a nearing pullback, as its price exhibits similar patterns to previous downturns. According to technical analysis indicators like the MACD (Moving Average Convergence Divergence) and RSI (Relative Strength Index), DOGE is at a critical point, signaling the potential end of this phase.
MACD and RSI Indicators Hint Reversal
From the analysis provided by Trader Tardigrade, the price has entrenched tendencies of taking some resistance levels and then pulling down in a decreasing manner. The MACD indicator shows a trading range from the middle of 2022 through early 2023 when the price stayed range-bound.
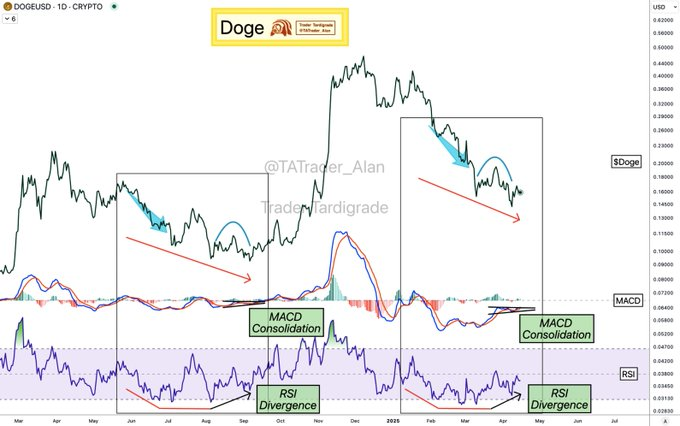
However, there is an opposite case with the Relative Strength Index (RSI), which illustrates the rising trend of the upward movements coupled with the downward ones. The RSI becomes weaker as the price starts falling, with the appearance of a downturn in the RSI indicating a weak buying signal. During these periods, it is also clear that there are flips in trends in this chart characterized by instability and changes in the price.
The MACD and RSI are strategic measures that are used to analyze trends in the market. At the moment, both of them look surprisingly good, as do other similar pullback patterns that we have observed in the past. This means that Dogecoin is then ready to head North once this phase is done, depending on the charts as analyzed below.
The MACD, which measures the difference between the short and long-term moving averages, seems to move up which is healthy for the bulls. The indicator of the relative strength index, showing the state of recent price activity, is also signaling an oversold level. This must eventually be followed by an up-trend of the market prices.
Technical Analysis Points to a Possible Surge
With both the MACD and RSI showing strong reversal signals, technical analysts are closely watching for a potential breakout. If the current trend follows the historical pattern of Dogecoin’s price action, it could be set for a substantial pump.
Traders may expect $DOGE to break past key resistance levels and possibly trigger an influx of buying activity. Given the past performance of the coin, the final stages of this pullback could be a crucial period for both short-term traders and long-term holders.
As DOGE moves near the end of this pullback, the indicators point to the likelihood of a surge, aligning with previous price cycles. With this in mind, Dogecoin could be positioning itself for a new rally in the near future.
What Is The Current Market Action?
Tracking the current market performance at the time of writing, the price is $0.1592. The market capitalization stands at $23.7 billion, reflecting a 4.39% decline in the last 24 hours. Trading volume for the past 24 hours is $883.55 million, down by 8.80%.
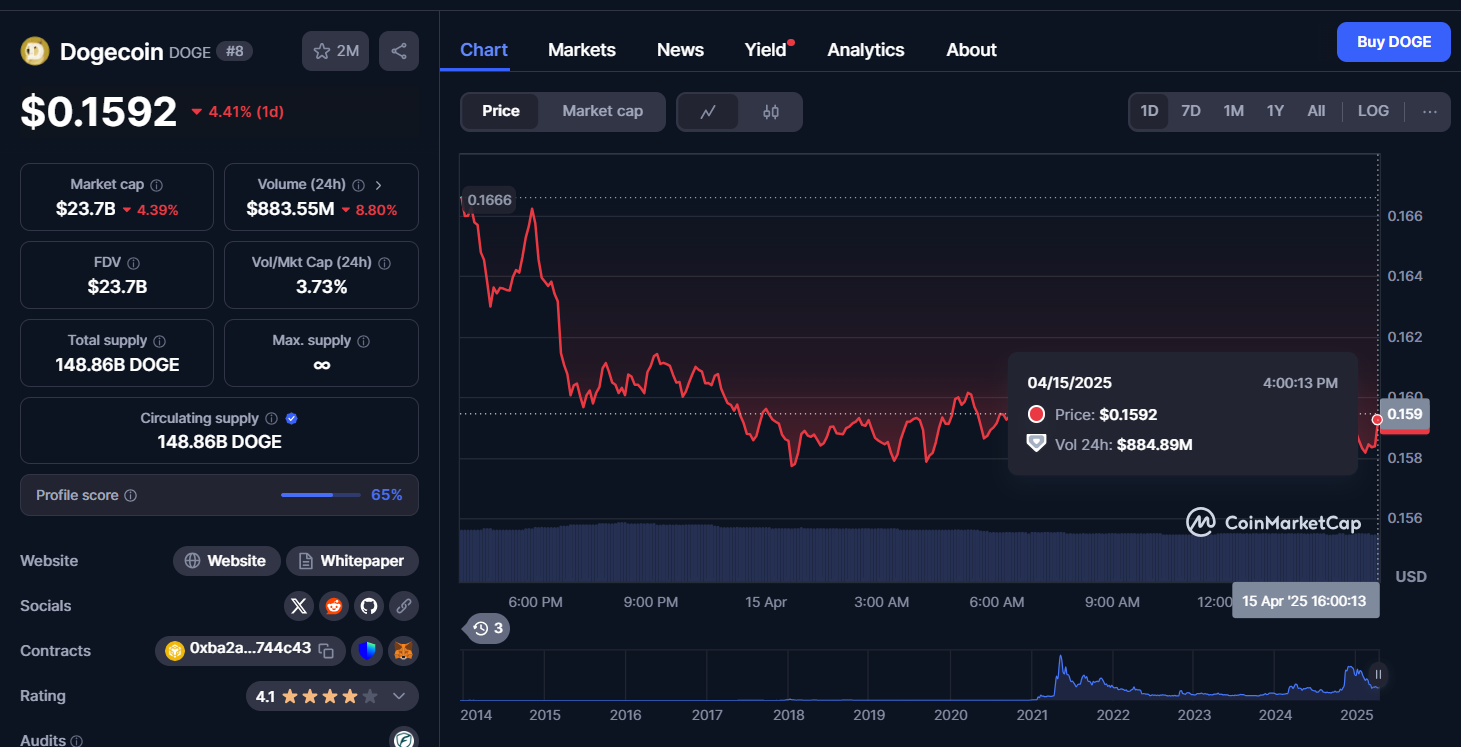
The circulating supply of DOGE is 148.86 billion coins, which is also the total supply. The price chart shows a consistent downtrend in recent hours. Dogecoin’s overall market sentiment is bearish, with a price drop continuing through the day.


