
- RSI at 46.96 and bearish MACD suggest potential short-term downside.
- Classic bearish setup hints at a possible drop toward the $1.70–$1.90 support zone.
- XRP price shows strength against 2022–2023 values, which demonstrates that investors maintain their confidence in the asset.
The popular altcoin XRP experienced an exhilarating market rally, which pushed it towards $3 during the early part of this year, but is now situated in a critical period of market consolidation. Market observers keep an eye on a possible downturn in XRP as traders monitor classic chart patterns that suggest the price may drop. It now faces an industry-crossing decision point because its price shows limited movement, and analytic signals present contradictory signs while traders question whether bullish trends will return or the market should expect substantial price falls.
XRP’s price has entered a stable period after its substantial gains in the first part of 2025, according to Bitstamp’s daily rates against USD. The market valuation rose almost to $3 during the early parts of 2025 but has since corrected to spot at $2.075 with a small 0.37% decrease in daily price. The price of XRP holds elevated positions when compared to its 2022 and early 2023 levels, which present evidence of sustained investor belief in the asset. The price keeps alternating between strict boundaries in a manner that indicates fading upward momentum.
MACD and RSI Hint at Weak Momentum for XRP
Market indicators show that XRP presents signs of potential future price reduction in the near term. The Relative Strength Index (RSI) shows 46.96 at the moment while sitting below the midpoint of 50, which indicates neither bullish nor bearish conditions. The MACD indicator shows minor bearish tendencies since its -0.05013 MACD line rests beneath its -0.07025 signal line, though the histogram points toward convergence.
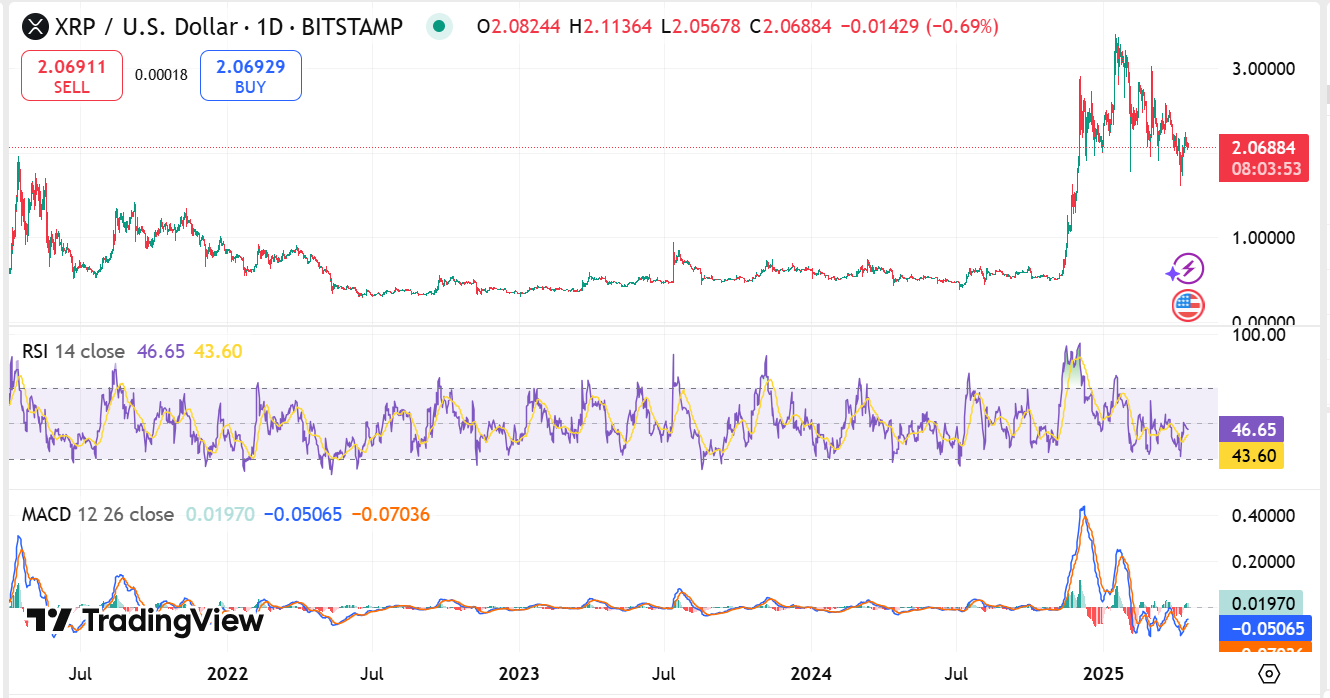
Source : Tradingview
The price of XRP could return to evaluate support zones extending from $1.70 to $1.90 if it remains unable to gain upward momentum. The price may move toward recent highs if the price experiences a bullish crossover and rising RSI value.
Analysts Warn of Possible Drop as XRP Hovers Near $2.08
Market analyst @ali_charts applied technical expert Thomas Bulkowski as he displayed a well-known “head and shoulders” pattern structure in XRP’s price history through an update on social media. According to this post, Bulkowski’s research shows that price pullbacks after a neckline break occur for trading purposes, thus making trading “interesting.”
The technical assessment shows that it may form a bearish continuation pattern that would intensify price fall. Analysis of the technical setup by DD analysts occurs through historical stock charts of AMD to confirm functionality.
Current XRP market action
The value of XRP continues at $2.06 as it experienced a 1.39% decrease during the previous 24-hour period while market volatility persists.It maintains a $120.64 billion market capitalization through CoinMarketCap, yet daily trades have reached $2.92 billion with a 6.69% fall. It demonstrates a recovery phase following its price reduction.
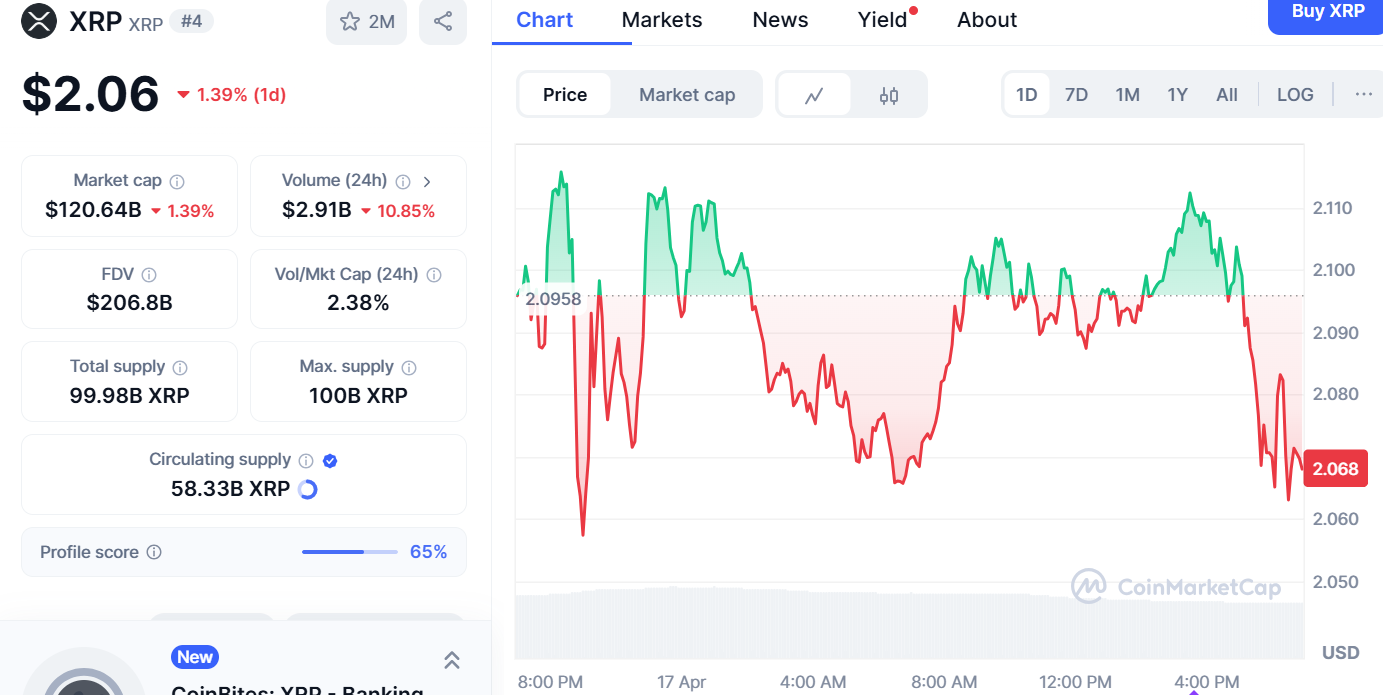
Source : Coinmarketcap
The 58.33 billion XRP in circulation within the market, alongside its 100 billion total supply, makes its price sensitive to historical pattern predictions that indicate more downward price movement.


