
- The technical indicators RSI and MACD show declining momentum yet Ethereum price holds a position near oversold areas.
- The trendline analysis presented by expert analysts indicates that ETH will reach its key recovery stage in the long-term price chart.
- The market experienced a 25% decrease in trading volume as the price experienced substantial fluctuations across the day due to investors increasingly expressing doubts and fear.
Ethereum (ETH) experiences increased bearish pressures in the market as investors grow concerned and technical indicators start declining while the price reaches $1,582.15. The market showed temporary growth before Ethereum’s value continued its falling trend at distances beyond its initial $4,000 beginning of 2024 price point.
Ethereum Slides Toward Key Support Zone
ETH trades at $1,585.5 during this bear period where it lost 0.18% of its total value. Since January 2024 until now Ethereum has endured continuous selling activities leading to a dramatic decrease which forced its price below $4,000. Market agents have grown more bearish after weak technical indicators combined with market risk elements made traders take a defensive market position.
Data from the Relative Strength Index (RSI) shows a value of 39.59 while moving average stands at 36.36 thereby indicating an upcoming oversupply but no actual oversupply condition exists yet for Ethereum. According to market experts investors may witness more prices drops except when a positive market influence emerges. The RSI maintained positions beneath 50 points throughout most of the recent period because buyers kept absent from the market. The buying market shows extreme interest in operations after the price falls below 30 points due to historical data indicating the potential for market direction shifts.
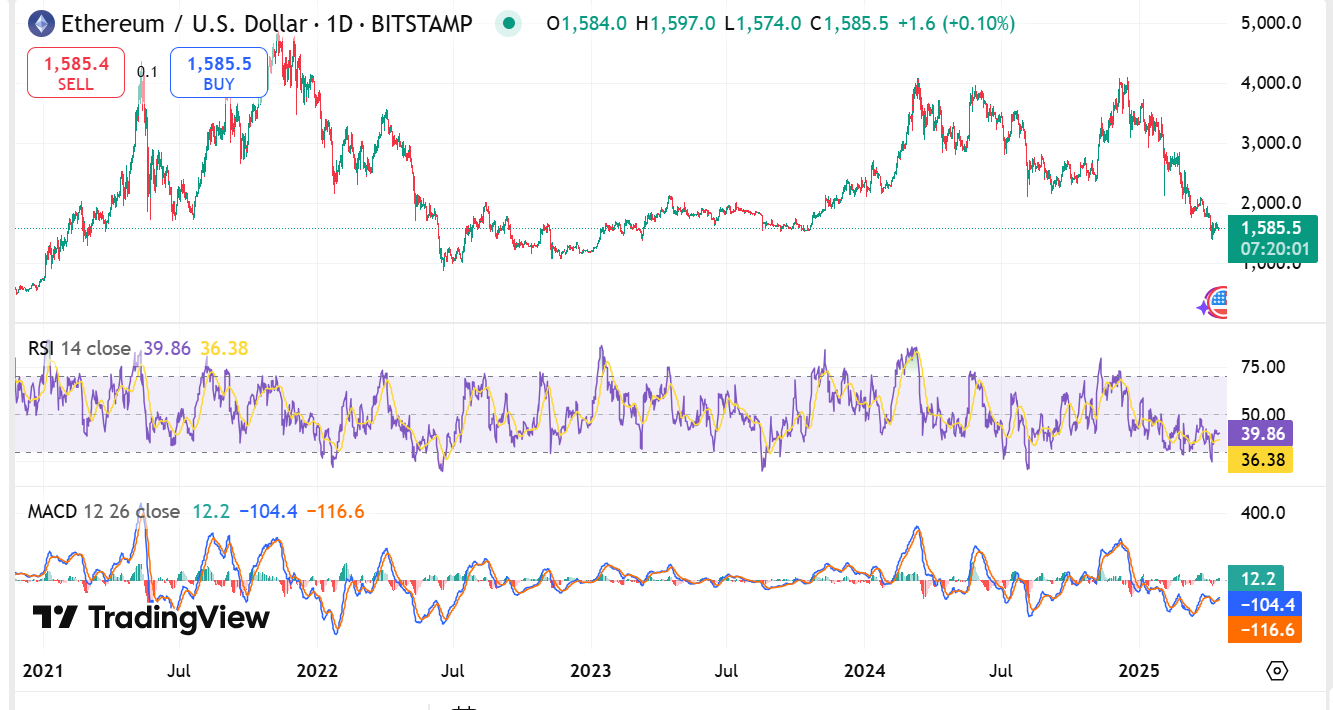
Source : Tradingview
According to steady analysis of the Moving Average Convergence Divergence indicator the market shows additional negative power because its MACD line sits at 11.9 points with negative signal and histogram values that are -104.8 and -116.6 points below the line. The negative placement of the histogram reinforces the bearish crossover pattern formed during the previous weeks. Ethereum requires overcoming solid resistance points along with stronger performance in technical indicators before short-term market forces shift to an upward trend.
Analysts Eye Rebound as ETH Dips Again
In a recent tweet, a crypto analyst urged investors not to dismiss Ethereum ($ETH) during its local price lows, suggesting current market conditions present a prime buying opportunity. The analyst analyzed Ethereum’s weekly price via a TradingView chart, which showed ETH/USDT touching the purple support zone while this zone followed an extended ascending trendline.
A tweet shows Ethereum maintains a price of $1587 during the time, while six months ago, users considered these levels to be the perfect entry point, thus showing investment potential despite the current market dip.
Ethereum Price Action
The price of Ethereum (ETH) is currently at $1,585.32 because it has lost only 1.01% of its market value during the last 24-hour period. Right now, the market capitalization of the cryptocurrency reaches $191.34 billion, and its trading volume today stands at $9 billion while registering over a 36.14% reduction.
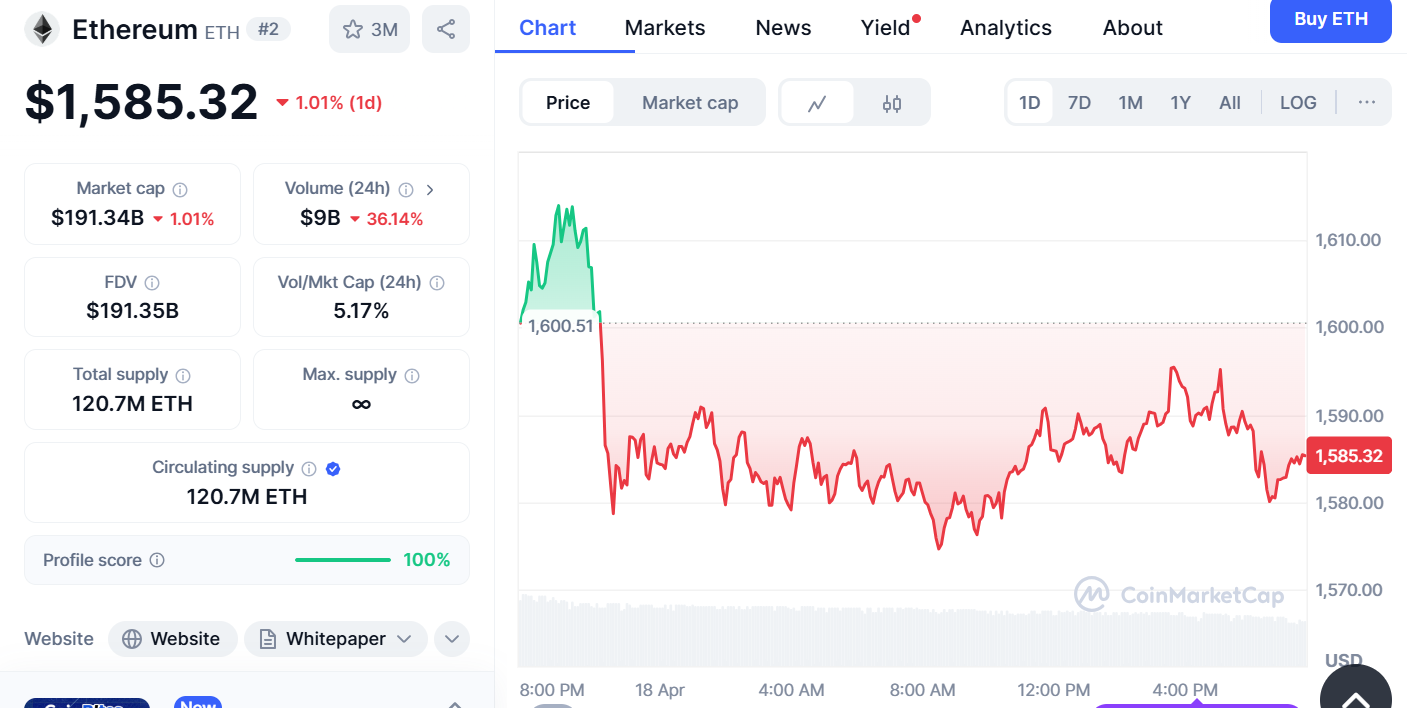
Source: Coinmarketcap
The number of ETH in circulation and total supply amounts to 120.7 million, while the fully diluted market valuation equals the market capitalization. An initial price jump to $1,610 after the start of trading soon turned into sudden market fluctuations that drove ETH value under $1,580 before the price settled. The market made a brief attempt to recover after noon, but ETH stays near its opening price of the day as investors demonstrate.


