
- HBAR charts bullish patterns targeting $0.335 and $0.525.
- Strong support at $0.120 holds as price rebounds to $0.1655 amid growing ecosystem.
- April 2025 eyed for breakout as RSI and volume trends favor upside.
Hedera (HBAR) is on the horizon, catching people’s attention due to strong technical indicators indicating such a price surge. The asset has held above a highly important support zone and has the potential to overtake its key resistance levels to go on an upward trend.
During the market volatility, HBAR went down to $0.1262. The cryptocurrency’s support level managed to withstand and rebounded strongly. Hedera is currently trading at $0.1655 and has a 24 hour trading volume of $107.42 million, with a market capitalization of $6.99 billion, as of the latest market data.
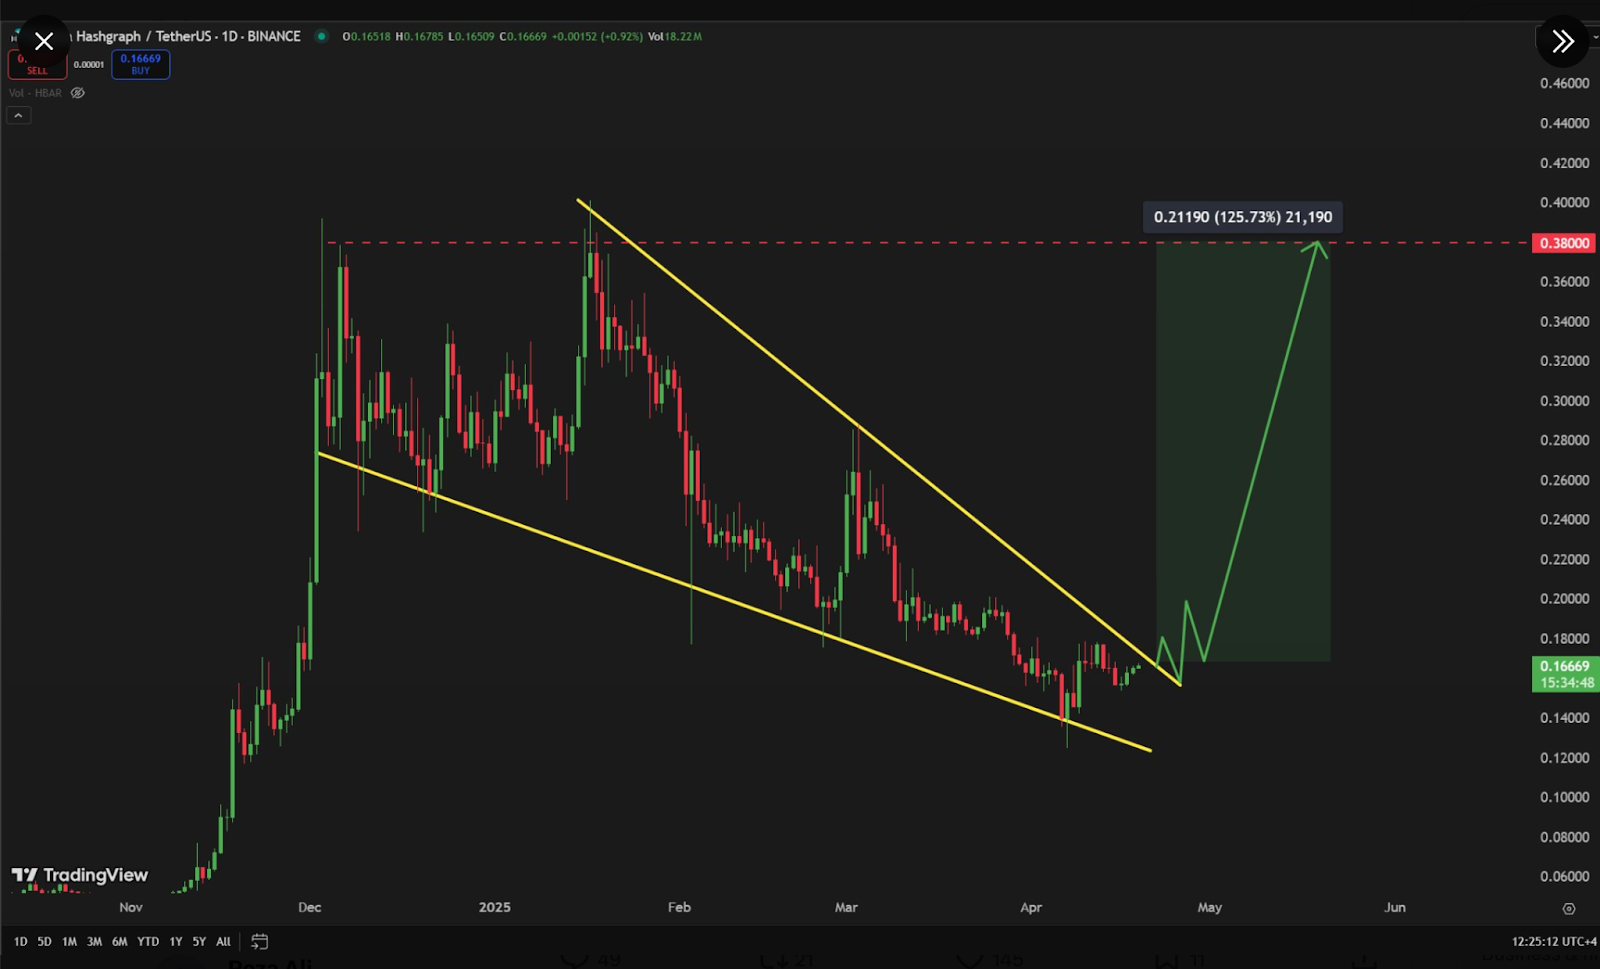
Technical Analysis Suggests HBAR Could Hit $0.38 Soon
Even though Hedera has experienced short term retracements, it is likely to make a big move upward. Technical analysis reveals shaped like two formations known as falling wedge and bull pennant both are considered bullish indicating the presence of such patterns. These setups are now being carefully watched by analysts, who may see any breakout of these setups mainly in April 2025.
In a post from MoonCarl, Hedera (HBAR) is analyzed by using a falling wedge pattern on a daily chart, a technical indicator indicating a potential price breakout to $0.38, lower selling pressure and more potential reversal.
Hedera is expanding its ecosystem with Chainlink’s CCIP integration to both cross chain with Ethereum and Avalanche, which will aid Hedera’s DeFi growth and price momentum.
Hedera has been in a bullish reversal pattern since late 2024, falling wedge, which has developed over several months. This bears a structure, declining trading volume, and a bullish divergence on the Relative Strength Index (RSI) that suggests a diminishing selling pressure. In case a breakout is triggered, the projected target for the pattern is at $0.335, which would constitute an impressive rally from the current price level.
Technical Patterns Signal Major Upside for HBAR
Also, the bull pennant a continuation pattern following a sharp upward impulse provides for the more aggressive move. If this setup is confirmed, HBAR is likely to take a sharp correction and aim towards a target of $0.525, which shows the strength of its preceding rally. In technical analysis, bull pennants are considered indicators of ongoing trend that is bullish, and found when price are above the boundary to the top of the pattern.
Traders and investors will be focusing on key levels. However, on the other side, the $0.120 support is barricaded by a HVN and the 0.786 Fibonacci retracement level, indicating that the area will provide a barrier against further price drops. Resistance at $0.180, a previous swing high, stands as the next major obstacle. If HBAR adapts past this zone, it will experience more resistance within the price range of $0.320 to $0.460, which happens to be an historical supply area starting since the March 20th 2021.
With the current chart formations, HBAR currently forms a compelling case, if market participants are looking for high potential plays. Important strategic entry points can be determined via close attention to $0.120 support level and confirmation of RSI breakout. With the broader crypto market in flux, Hedera’s demonstrated ability to convert technical strength into a growth that lasts will be essential in regaining bullish momentum in 2025.


