- MACD crossover and RSI above 50 suggest growing buying momentum and a potential trend reversal.
- A 54.08% spike in 24-hour trading volume points to renewed investor interest and increased market activity.
- A “9” candle on the weekly chart hints at trend exhaustion, potentially leading to a significant upward move.
Shiba Inu (SHIB) is catching the crypto market’s eye once again as signs of a bullish turnaround begin to surface. Increasing continuously in price, trading volume points up at the same time, it received positive technical indicators, which may be a sign that the meme coin is ready to break out. Speculators and strategists over the Internet are paying attention, and some of them believe that SHIB is likely to experience a massive movement. Can this be the start of a new rally for the dog-themed token?
Shiba Inu Forming Bullish Channel
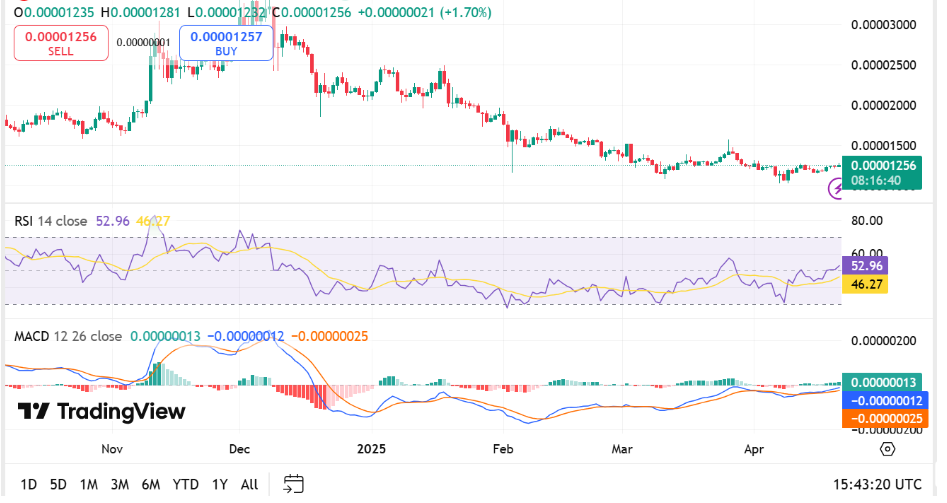
Shiba Inu (SHIB) the meme-based cryptocurrency is trading at $0.00001256, reflecting a 1.70% daily gain. The chart from Coinbase shows a moderate upward trend after a rather long lateral trendline, which started back in mid-April. RSI is at 52.96, relatively above the center line, and this is an indication that the bulls are gaining more ground without being overly optimistic because the center line is at 46.27. In this regard, there is a small sign of a turning point or the preparation for such a scenario by traders, indicating a possible reversal of the downtrend or accumulation phase.
Source: Coinmarketcap
Further supporting this outlook is the MACD (Moving Average Convergence Divergence) indicator, which shows the MACD line (blue) crossing above the signal line (orange), a classic bullish signal. However, the November high indicated that further gains in SHIB are possible to continue for at least the short term if buying pressure persists. The next level of interest can be found at $0.00000013 as it has acted as a floor in the past, with the support at $0.00000025 area. As the market indicators become seemingly well-positioned and market-based volume does not look too bearish, Shiba Inu may be set for recovery during the next quarter.
According to analyst Ali, SHIB has formed a bullish reversal on the weekly chart where a bulls eye awaits in light of the formation of the TD Sequential “9” candle, which is equated to range low volume profile commonly known to signal an upside bounce. The bullish run may be weakening, given that the weekly close at $0.00001234 was 2.41% higher than the previous week.
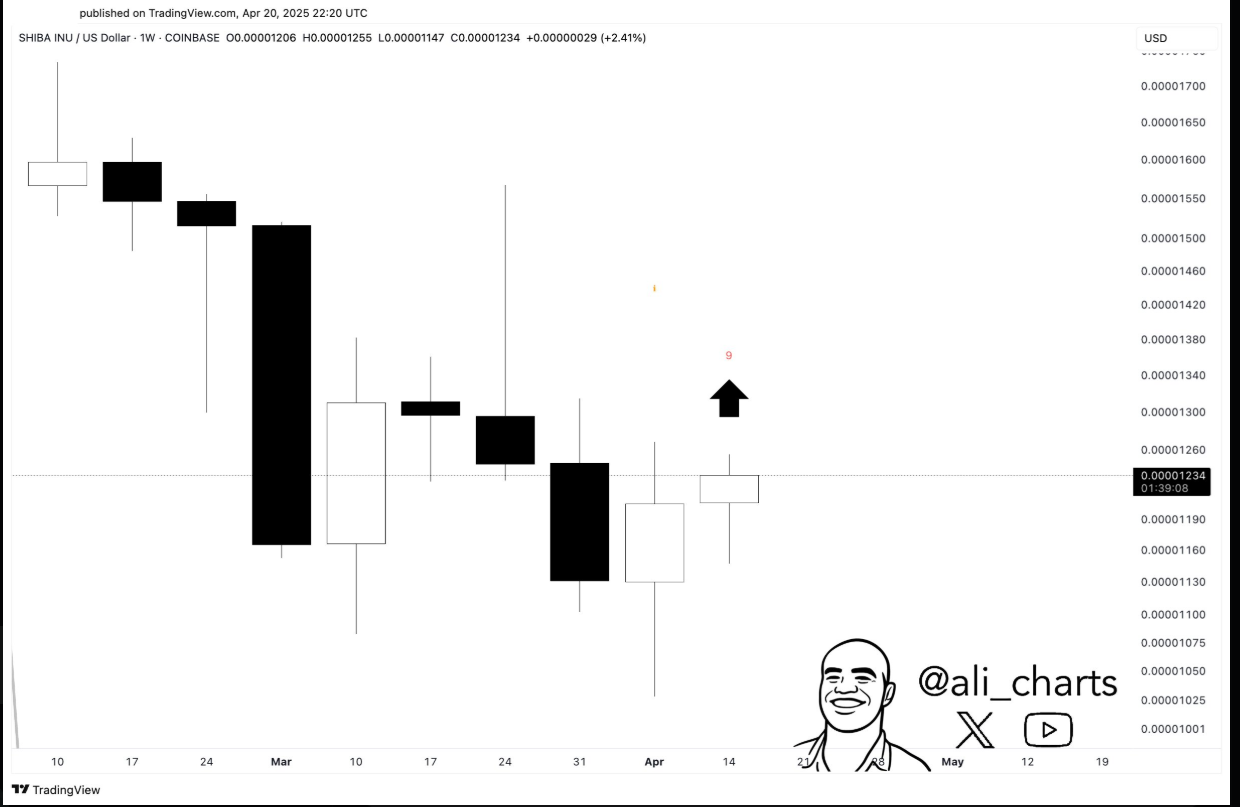
Source : X
A fearless upward spike at the upper part of the chart further strengthens this signal, suggesting that SHIB may be set for a change in trend after weeks of ranging and falling movements. If the signal plays out, SHIB may find resistance volumes around $0.00001380, and it may bring back attention to those who are trading with an eye on long-term trends.
SHIB Price Analysis
Shiba Inu (SHIB) experienced a modest price increase of 2.03% over the past 24 hours, bringing its current trading value to $0.00001254, according to data from CoinMarketCap.These include market capitalization, which is at $7.39 billion, an equivalent of the same percentage increase. Also of interest is the average trading volume that rose by a 54.08% increase to $ 153.99 million over 24 hours. SHIB’s circulation is estimated to be around 589.25 trillion tokens, which is quite close to the maximum limit of 589.55 trillion tokens.
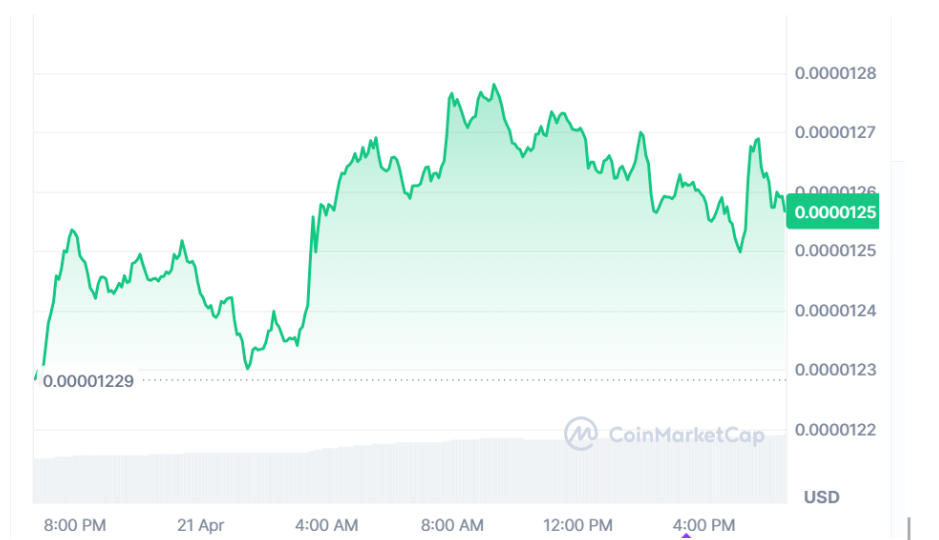
Source : Coinmarketcap
Volume-to-market cap ratio is taking the value of 2.07%, which can pose further signs of operators increasing their activity, so far signaling the possibility of more market movement in the next few days.


