- XRP forms an inverse head-and-shoulders pattern, hinting at a breakout toward $2.75.
- A 6.80% price surge and 128.78% volume spike signal strong market interest.
- RSI and MACD indicators confirm growing bullish momentum on the daily chart.
XRP is turning heads in the crypto world as it kicks off the week with a powerful bullish surge. Fueled by strong technical patterns, rising investor interest, and a spike in trading volume, the digital asset is showing signs of a major breakout. Analysts are eyeing a key resistance level that, if breached, could propel XRP into new price territory. With momentum building fast, all eyes are now on it’s next move.
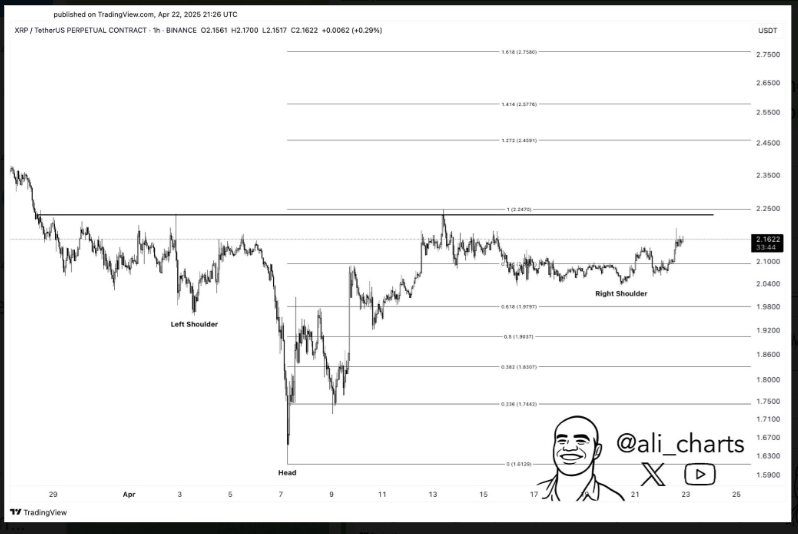
According to Ali, XRP is displaying a classic inverse head-and-shoulders pattern on the 1-hour chart, a historically bullish formation that suggests a possible breakout is imminent. The pattern, clearly marked with a left shoulder, head, and right shoulder, finds neckline resistance around the $2.25 level.
Source: X
Market participants watch the XRP price action near $2.1622 while it tests neckline resistance because a successful breakout could initiate an immediate upward movement to the $2.43–$2.75 range, which aligns with Fibonacci extension levels. The technical condition indicates strong upward potential for XRP when market buyers maintain their current momentum throughout successive trading periods.
XRP Price Action
In a robust 24-hour rally, XRP has surged by 6.28% to reach $2.26, marking a significant bullish move in the crypto market. The market capitalization increased while the trading volume surged by 125.13%, which resulted in $132.03 billion and $5.86 billion, respectively. Market participants show increased buying pressure, which seems to stem from positive market conditions and Ripple-related news events.

Source : Coinmarketcap
XRP has a circulating supply of 58.39 billion while its total supply stands close to reaching 100 billion. The daily price movement demonstrates increasing value combined with robust support based on current trends, which indicate further price growth throughout the coming short period.
RSI and MACD Indicators Point to Continued Bullish Trend
XRP is showing renewed bullish momentum as it trades at $2.26, marking a 2.19% daily gain, supported by encouraging technical indicators on the daily chart. The Relative Strength Index (RSI) now stands at 58.26, which indicates that it might enter overbought levels while increasing demand from buyers. The Moving Average Convergence Divergence indicator generated a new bullish signal after its MACD line surpassed the signal line.
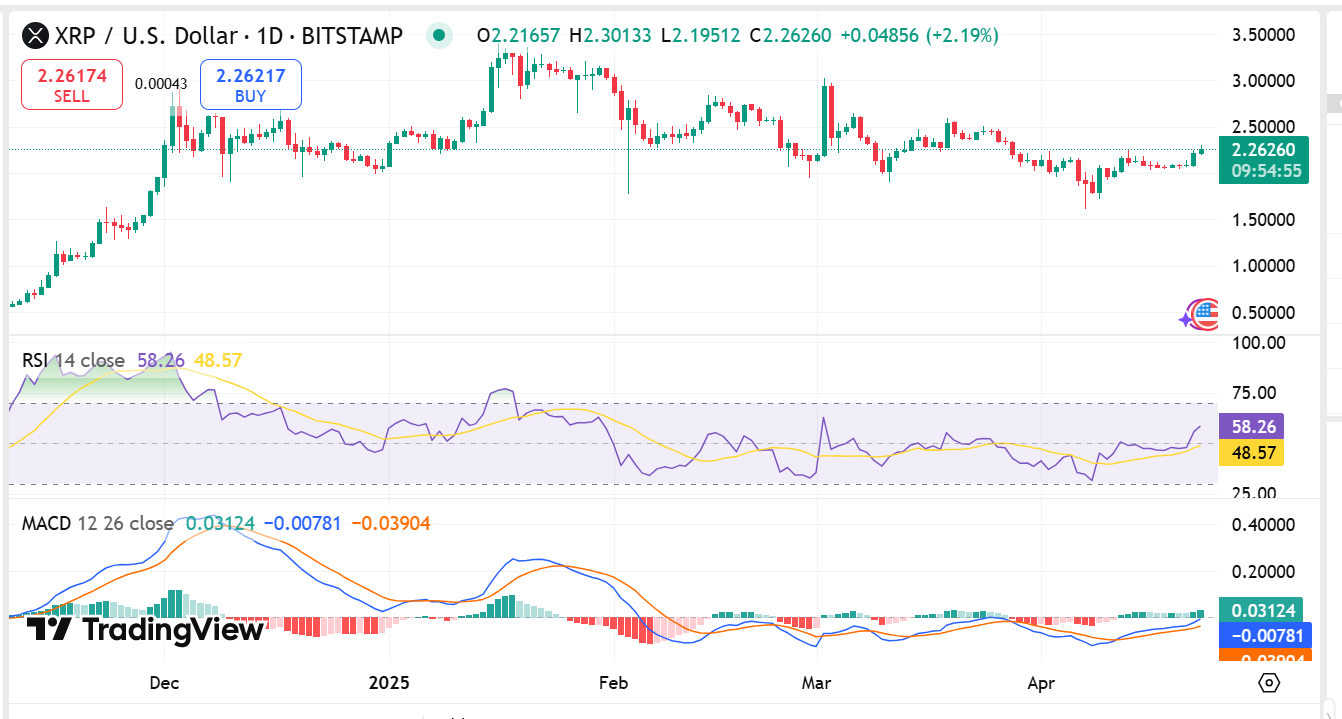
Source : Tradingview
An upward trend in XRP price appears as the digital token recovers from its recent persistent periods of stabilization which indicates stronger investor commitment toward continuing market growth.


