
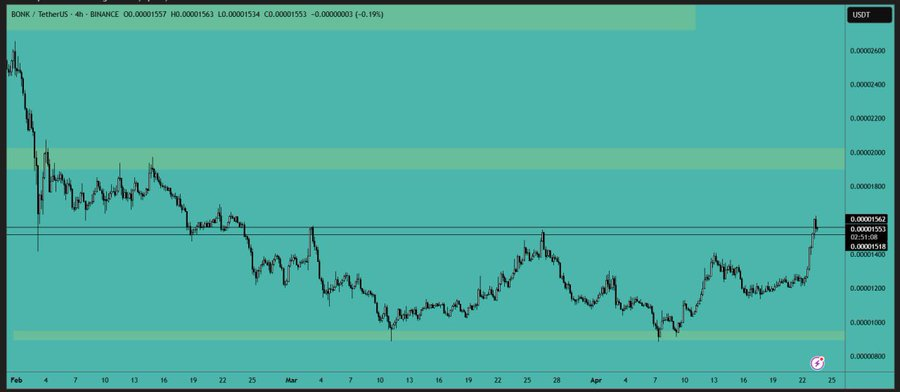
- BONK is currently at a major resistance level and is capable of rallying to 70% to 80% if it forms this breakout.
- The token grew by 8% in the last 24 hours with the trading volume also increasing by 102% to $165.77 million.
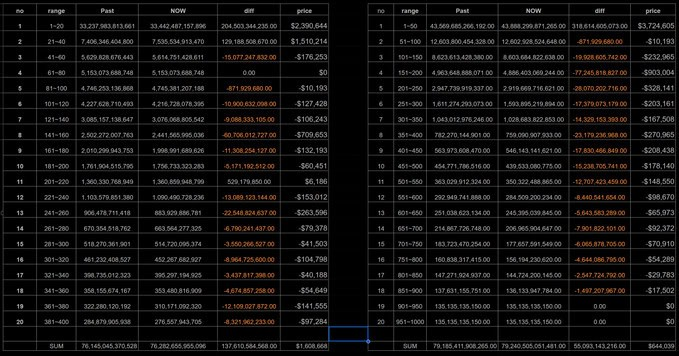
- Analysts are waiting on a support flip as whales’ flows and on-chain metrics indicate accumulation.
BONK (BONK) is displaying buy signals on the 4-hour chart as it approaches a critical resistance level. This meme coin has been around for the past few weeks and is now above $0.00001360. For instance, the upward movements have been restrained at $0.00001350 and $0.00001550 in the previous trading sessions.
BONK is trading at $0.000137 on April 23 and rose by about 8% in 24 hours. There was a 129% increase in trading volumes to $165.77m in the wake of the rally. Market capitalization is now $1.07 billion, which has increased with investors’ optimism.
The move is more aligned with the overall market trend as the Bitcoin price surpasses $90,000. BONK is under the radar of traders looking for short-term breakout trades. Technical analysts, following its price movements, expect the token to rise to between 70-80% once it finally breaks through this level of resistance.
If BONK is able to break through this resistance level, AMCrypto suggests that it may surge by up to 70% to 80%. At the same time, the price bounced to the resistance zone, but it needs to reverse it into support before traders open new positions. Until this scenario comes to pass, the market needs a confirmation of the breakout.
Whales and Retail Traders Show Renewed Interest
On-chain data shows an increase in activity from whales as well as small retail investors. Despite such an increase in whale inflows into centralized exchanges, the prices have remained relatively high, which is indicative of ongoing accumulation. The bullish trend is further supported by the growing interest from retail investors.
In the corresponding areas, support zones have remained robust, indicating increased demand from buyers. Since mid-April, the technicals exhibit higher lows, while the divergence in the RSI suggests a continuous advance with a few brief corrections.
Bonk Volatility Expected if Support Fails
If the price drops below $0.00001550, short-term volatility might increase. This previous support level can be found to be near $0.00001100, so it may act as support in this case, too. However, as the overall market shifts to being more positive, and with Bitcoin in an upward movement, downside risks are expected to be fairly limited in the short term.
The chart shared by BitMonty illustrates a breakout from a consolidation channel. BONK is now backtesting previous resistance levels, with a possibility of breaking above $0.00001800 with further pushes.
Analysts hope to capture a bullish reversal pattern as meme coin continues to try and push higher. A breakout above a resistance level can predict a multi-week bullish run, in which BONK will be placed among the highest-ranking meme tokens.


