
- Bitcoin spot ETFs witnessed a net investment of about 31,323 BTC in the previous week and a renewed institutional investment.
- Bitcoin is still trading below the $95,000 level, while a robust appetite for ETFs contributes to the ascending price.
- Ethereum ETFs had their first net outflows of funds in the previous eight weeks, indicative of a better outlook on ETH-based products.
The spot ETF Bitcoin space surged in the past week, with US funds experiencing a net inflow of 31,323 BTC. The BTC inflow was estimated to be roughly $2.9 billion, making it the fifth-largest such movement in Bitcoin terms and the third-largest in dollar value. November 18, 2024, recorded the highest net inflow of $3.33 billion, and December 2, 2024, was the 2nd highest at $2.91 billion.

This increased trading activity across ETFs points toward a new cycle of institutional investment regardless of the current price hovering in the normalized levels. Glassnode data also reveals that the overall ETF holding has a progressive pattern over time, and the major providers include BlackRock, Fidelity, and Grayscale.
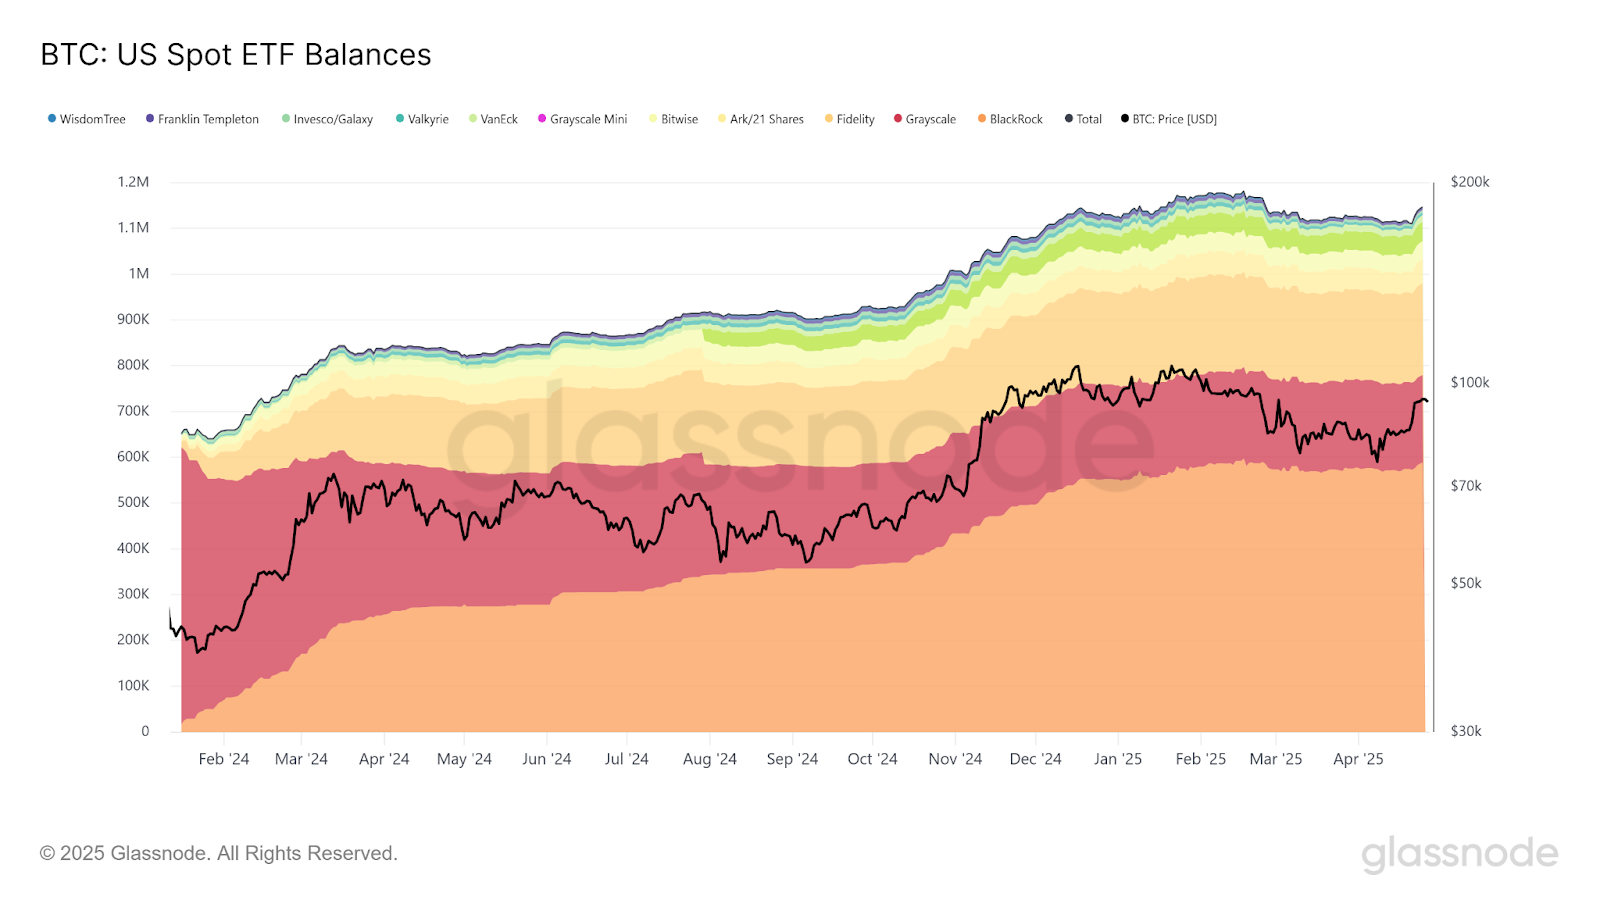
As of the time of writing, Bitcoin is trading at $94,782.52, an 8.32% increase for the past week. It has a market capitalization of $1.88 trillion and a circulating supply of 19,85 million BTC.
Ethereum ETFs Show Signs of Recovery
On a similar note, US-based Ethereum spot ETF witnessed the first inflows in the past eight weeks. The inflow amounted to about 40,000 ETH, which may indicate a change in investors’ sentiment towards Ethereum investment products.
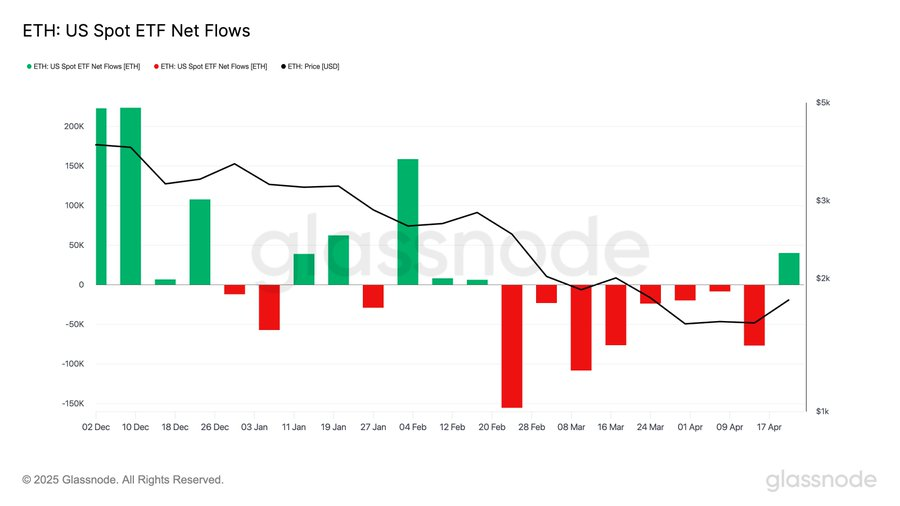
Glassnode data suggests that the rates of inflow, although lower than that of Bitcoin, could be similar to that seen in the early stages of the Ethereum recovery. Over the past week, Ethereum funds have been recording outflows on a weekly basis while the market price of ETH has also dropped. However, more recent flows indicate a rising demand to obtain ETH once again as the sentiment in the market becomes more stable.
BTC Price Analysis
Bitcoin’s recent bounce to $74,400 propelled the price through several key technical levels. The 50-day SMA at $ 85,100, the 100 SMA at $ 90,570, and the 200 SMA at $ 89,300 all recovered as support levels.
Popular analyst AlphaBTC noted that the BTC price is pressured just below $95 000. Monitoring resource CoinGlass highlighted these levels as substantial in liquidity, with Bitcoin likely to seek liquidity at these levels before retreating significantly to $97,000-$100,000.
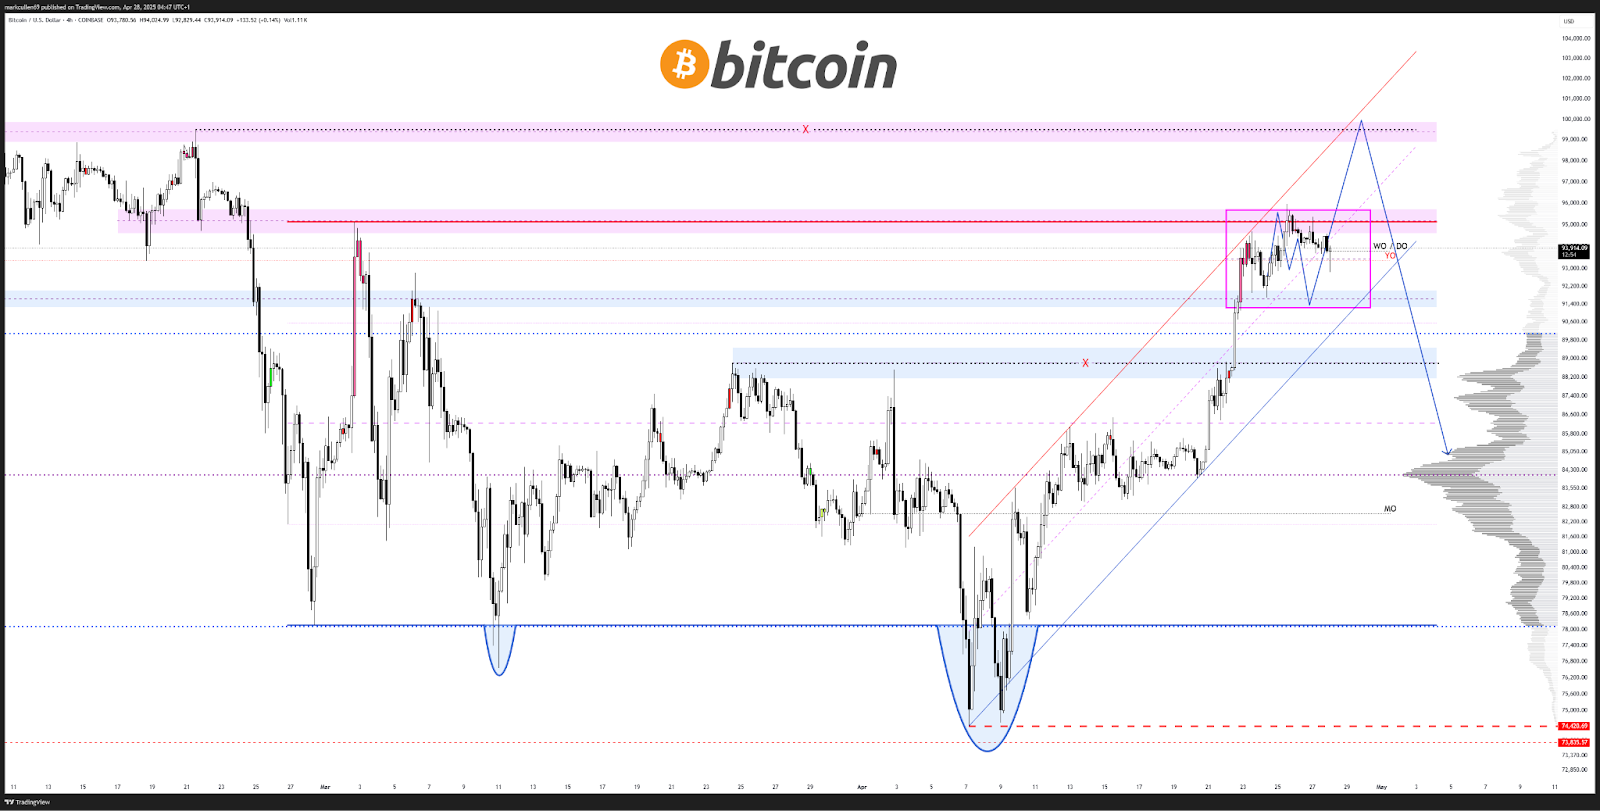
Keith Alan, co-founder of Material Indicators, downplayed the chances of Bitcoin holding above $95,000 without any more triggers. QCP Capital echoed a similar sentiment, stating that there is no substantial market driver that could propel Bitcoin above the $100,000 psychological level.
In addition, data provided by CoinGlass noted significantly high sell volume within the $97,000-$100,000 range, which implies that Bitcoin may try to take out the liquidity pool before facing a more significant resistance.
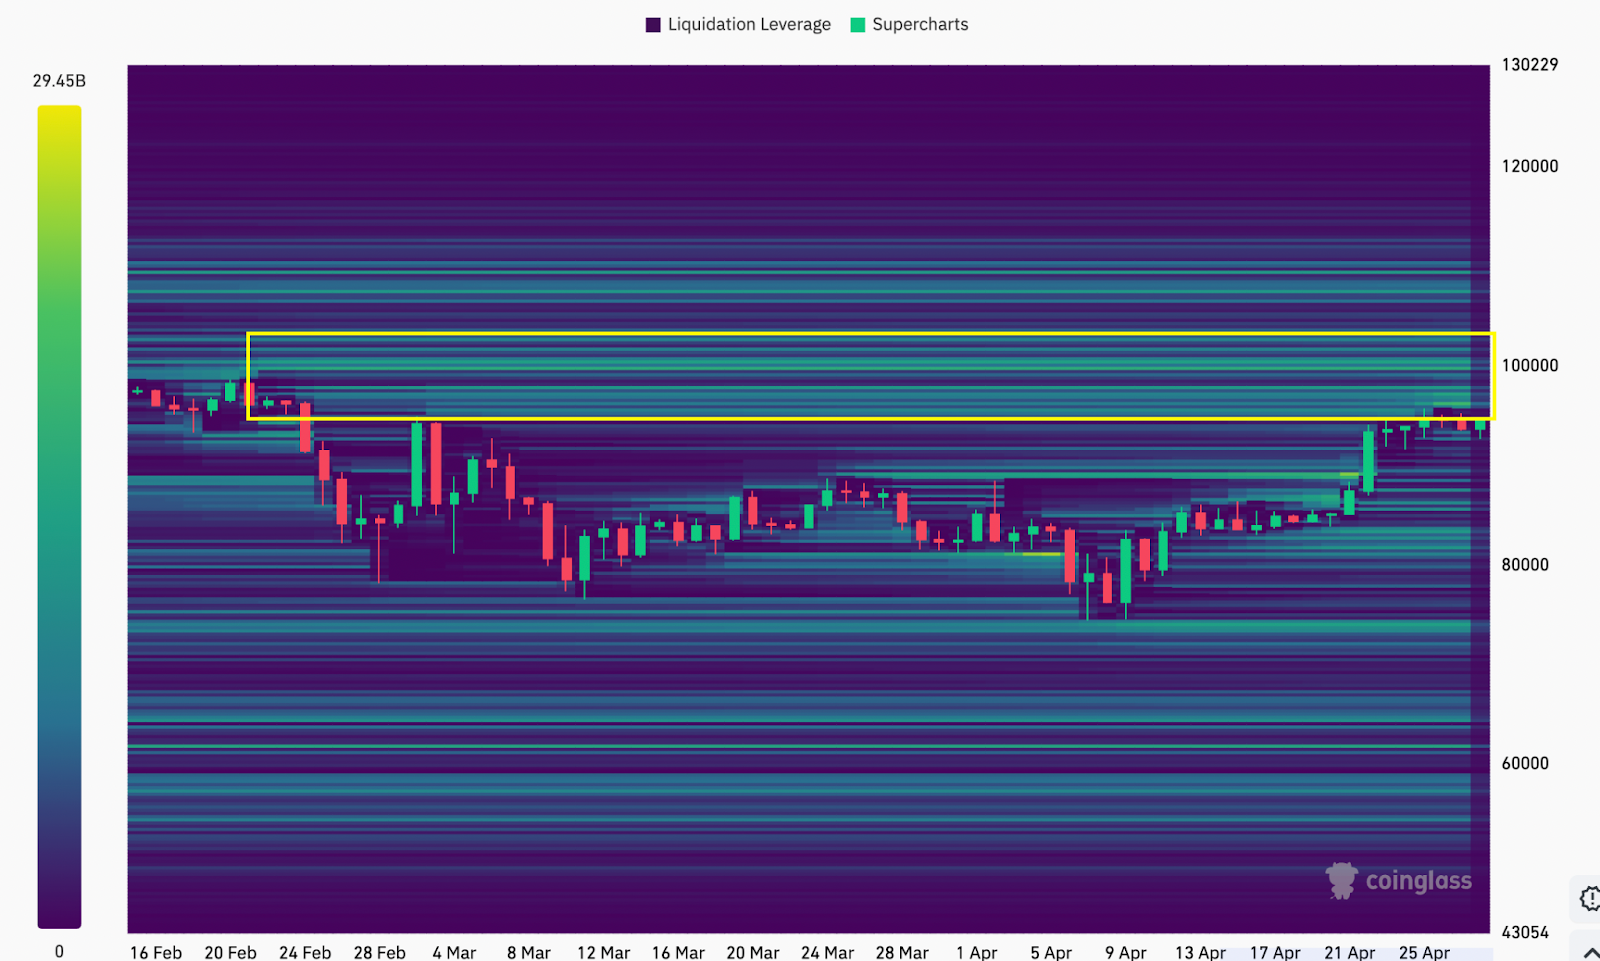
As for the balance of inflows and outflows from CoinGlass, the BTC outflows remained high in March and April, while there were occasional sharp increases in inflows coinciding with the positive price dynamics.


