
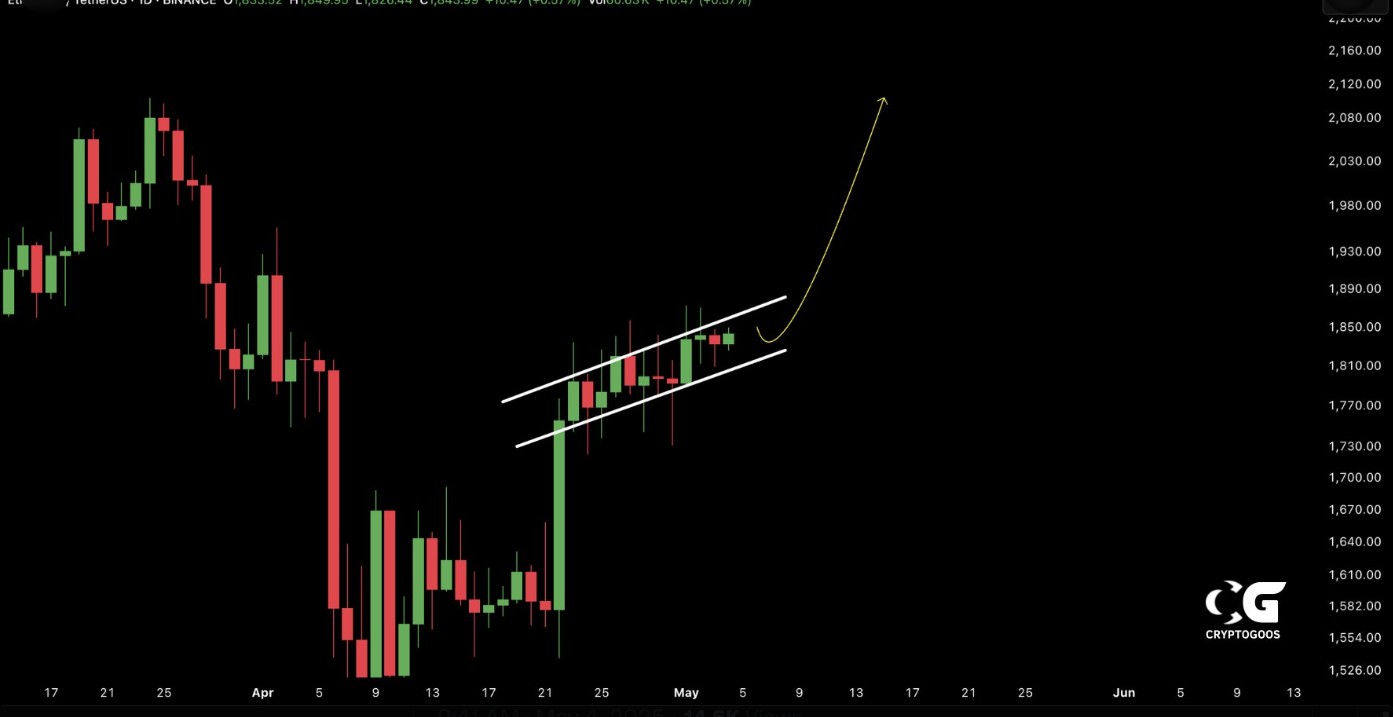
- Ethereum is trading within an ascending channel, signaling a potential breakout toward $2,100.
- RSI at 58.12 and a bullish MACD crossover indicate growing buying pressure.
- Despite a drop in trading volume, price stability and recovery from dips suggest strong market sentiment.
Ethereum captures attention in the market due to reinforcing technical indicators joining forces with current price trends that indicate upcoming bullish movements. The cryptocurrency Evangelical Token (ETH) demonstrates new strength after market instability by trading inside an upward trend while its RSI and MACD indicators are both pointing up. Market stability has grown stronger because traders still hold faith in cryptocurrency investments while prices maintain their rise. Ethereum stands ready to become a leading crypto asset because experts predict its market value may reach $2,100 in the following days.
According to CryptoGoos, ETH maintained its upward climb throughout the day, reaching $1,843.99 with a 0.57% daily gain, supported by technical analysis of its well-established ascending channel. Market activities display healthy consolidation following the late April surge because consistently rising highs, together with rising lows, indicate intensifying bullish market sentiment. The price structure stays strong because trading volume has stayed at 60.63 K. Technical analysis signals that ETH could achieve $2,100 soon when the upper trendline breaks and buying force continues alongside positive macroeconomic circumstances.
Source: X
Current Price of Ethereum (ETH)
Ethereum (ETH) remained resilient today, trading at $1,832.5, marking a modest 0.01% gain over the past 24 hours. Market activity showed reduced participation levels after the price maintained stability because trading volume dropped by 21.00% until it reached $9.11 billion. The total market capitalization of $220.56 billion remained steady alongside 120.73 million ETH existing in circulation. Throughout the day, ETH volume exhibited variations as the exchange rate dropped below $1,820 before the price recovered to cross above $1,840 in early morning sessions. Analysts interpret the enduring market interest as an indication of investor trust because of overall market concern.
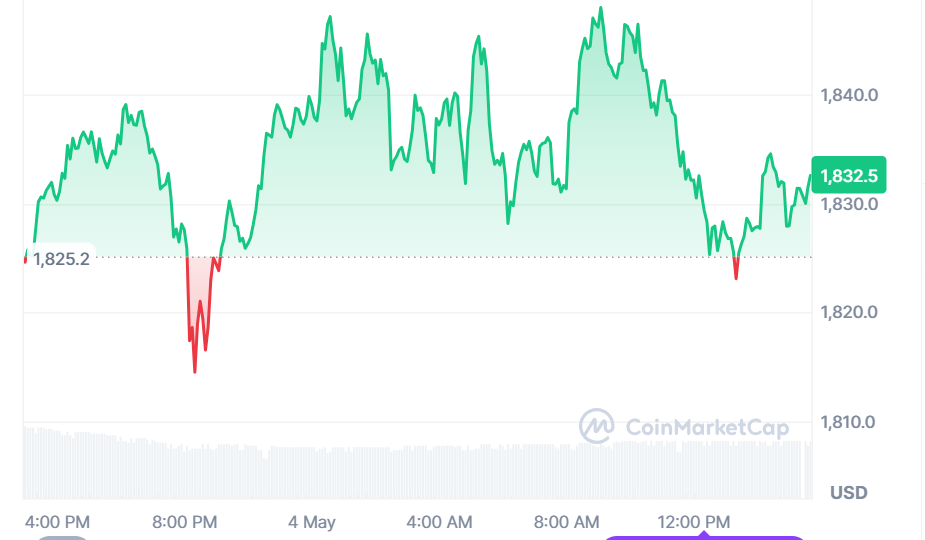
Source: CoinMarketCap
Technical Indicators Signal Bullish Momentum Ahead
The Relative Strength Index (RSI) reached 58.12, which exceeds former oversold reading points to show an increase in buying power before reaching the optimistic 70 threshold. The technical setup shows bullish momentum because the Moving Average Convergence Divergence (MACD) line has passed above the signal line, and the MACD stands at 14.30 while the histogram shows -14.81. The 537.19K volume stays relatively constant while price movements stabilize following downward pressure, indicating an imminent market breakout when buying momentum continues in an upward direction.
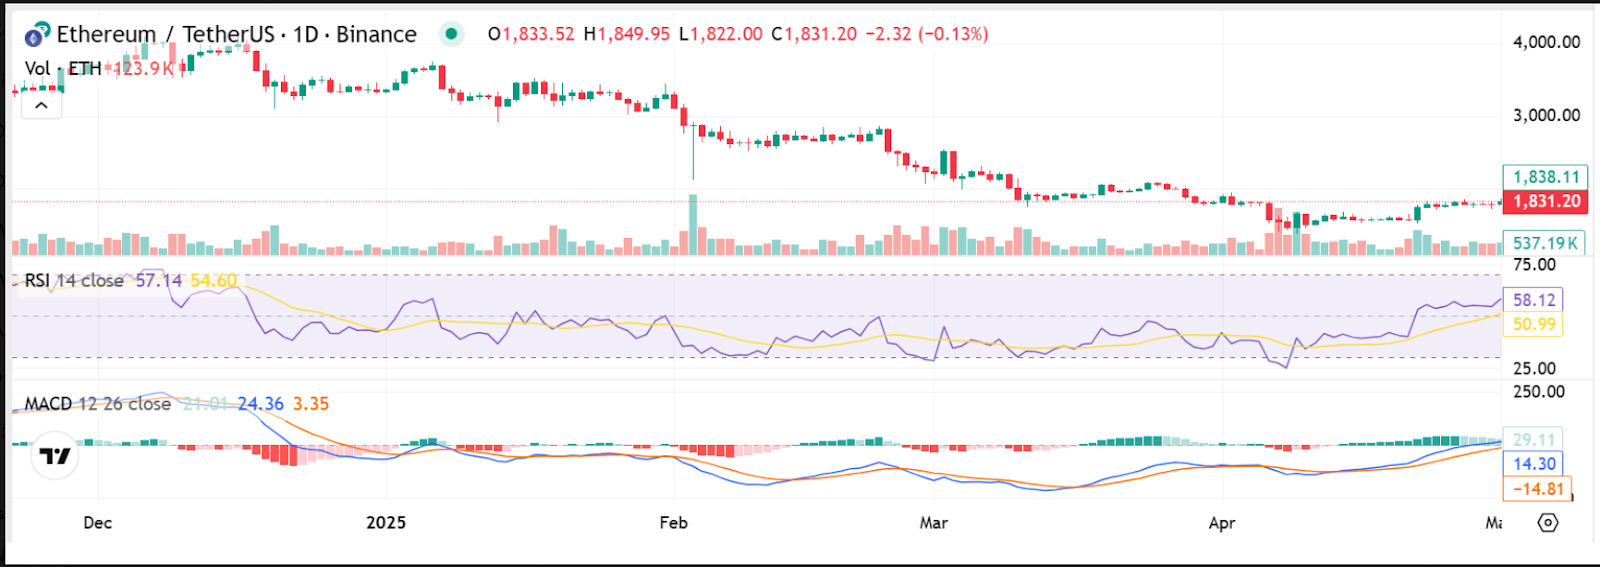
Source: TradingView


