- Hyperliquid (HYPE) surged 6% to $21.20 as Open Interest hit a record $697 million, signaling strong investor interest.
- Ethena Labs launched the USDe stablecoin on Hyperliquid, enhancing its DeFi and derivatives ecosystem utility.
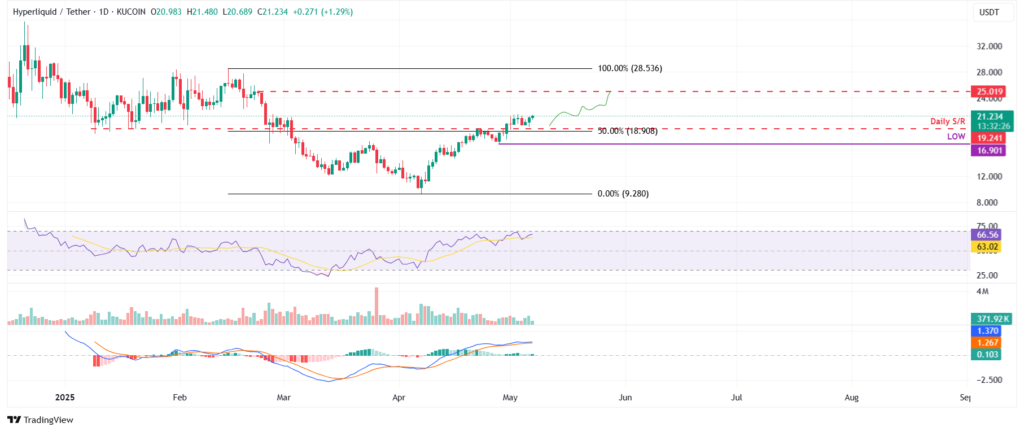
- Technical indicators suggest a potential 17% price rally, though risks remain if support at $19.24 breaks.
Hyperliquid (HYPE), a decentralized perpetual trading platform and Layer 1 blockchain, continued on its upward trajectory Wednesday, trading near $21.20 after recording a 6% rise thus far this week. As per CoinGlass, HYPE’s Open Interest (OI) attained a new all-time high of $697 million, thereby indicating rising investor interest in the token and a perhaps bullish trend.
Open Interest Breaks Records as Market Activity Heats Up
According to CoinGlass, HYPE’s futures OI skyrocketed from $622 million on Monday to a record high of $676.03 million early Wednesday. Generally, the higher the OI, the more likely new capital is entering the market. This strengthens speculative activity and a continued surge in the asset’s price.

USDe Stablecoin Launch Bolsters Hyperliquid Ecosystem
Ethena Labs said that on Monday, it integrated its HyperEVM blockchain and Hyperliquid exchange with its USDe stablecoin. This opens up a new Dollar-pegged asset in a quickly growing DeFi ecology and derivatives trading space. Adding USDe is expected to improve the utility and adoption of the Hyperliquid platform, potentially driving greater trading volumes and stablecoin liquidity and further protocol growth through strategic partnerships and product integrations.
Technical Indicators Point to Further Upside Potential
Technically speaking, there is more upside for HYPE. The token found support on Tuesday near a $19.24 level, which coincided closely with the 50% Fibonacci retracement level of the February 14 peak of $28.53 and the April 7 low of $9.28. HYPE had quickly recovered above these key levels by Wednesday, when we saw it trading at around $21.23.
If bullish momentum continues, analysts reckon there’s potential for an upside of 17% from here, with the next significant price target near the psychological $25. Momentum indicators reinforce this outlook: The daily Relative Strength Index (RSI) reads 66, above the neutral 50 level; the MACD indicator just flipped into long, as shown with a bearish cross earlier this month, signifying support for an upside trend.

Downside Risk Remains if Key Support Levels Break
However, potential downside risks remain. If support below $19.24 cannot be held, then it could be seen as bearish, and the price could be pushed lower, potentially right back to its April 28 low of $16.90. Market participants closely watch these levels as signs of either consolidation or a reversal.


