
- Solana trades back within a descending trendline, and $155.43 proves strong resistance.
- RSI approaches oversold, and MACD has gone into bearish momentum.
- Resistance at $110 continues to show firm support and will be key for price if it should continue to see rejection.
Solana (SOL) traded within a decreasing price range while staying beneath an active downward trend line. The SOL price on Binance reached $147.24, showing a 0.26% two-hour increase from earlier reports. Short-term investors started buying after the market value of this asset broke through the $140.83 support level. SOL experienced continuous resistance from a descending trendline that formed a diagonal barrier starting in mid-April.
In addition, the technical data reveals pricing movements stay limited inside a contracting zone. Showing traders’ intentions are unclear through the current trading range beneath the trendline. However, a price move above this trendline could modify the present trading structure. Successful crossings of this price range produce potential openings for more substantial resistance barriers. If the price experiences a rejection, it may drive another movement toward the $140.83 support zone.
The 0.236 Fibonacci retracement level sits at $155.43 as a key resistance point that has repeatedly blocked price advancement. The 0.236 Fibonacci resistance level at $155.43 has never been crossed during prior price action attempts.
The bullish continuation potential for SOL is constrained until the price achieves sustained movement above this critical resistance level. Price maintained its support level at $110 during the previous market cycles while showing strong defensive potential.
Momentum Indicators Point to Weak Short-Term Strength
Solana held a closing price of $145.48, which indicated a 0.31% decrease during its recent market trading session. Solana showed a downward movement after trying to rise toward the $148 price level.Solana’s Price momentum started to decline as the price approached the strong resistance area, which continued to reject price movements.
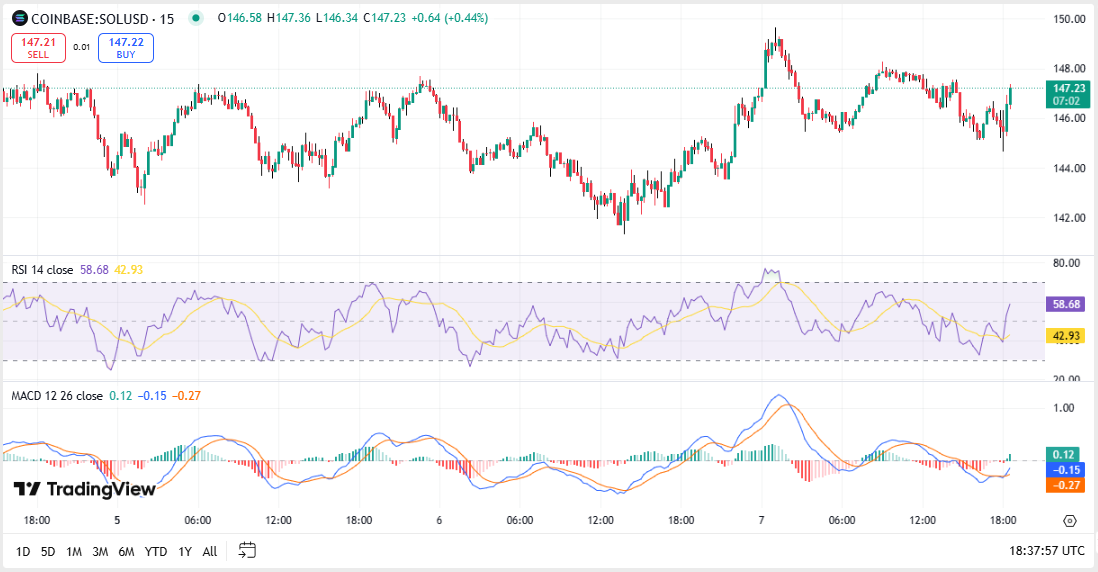
The Relative Strength Index has fallen to 39.21 and now approaches the zone where prices become oversold. A major bearish force began to materialize through this market action. During this period, the MACD indicator produced bearish crossover patterns as its signal line crossed over its MACD line from above. New red MACD histogram bars accompanied the momentum decline.
Fibonacci Levels Frame Medium-Term Market Outlook
Furthermore, according to the weekly data, SOL has still not recovered above the 0.236 Fibonacci level of $155.43. After the token hit its early 2025 peak, this level has since become a regular cap. Resistance and long-term support are at around $110; that is where the current trading zone is. It closed at $145.68, a slight gain on the candle for the most recent week. That move, though minor, did signal a modest return of buying interest.
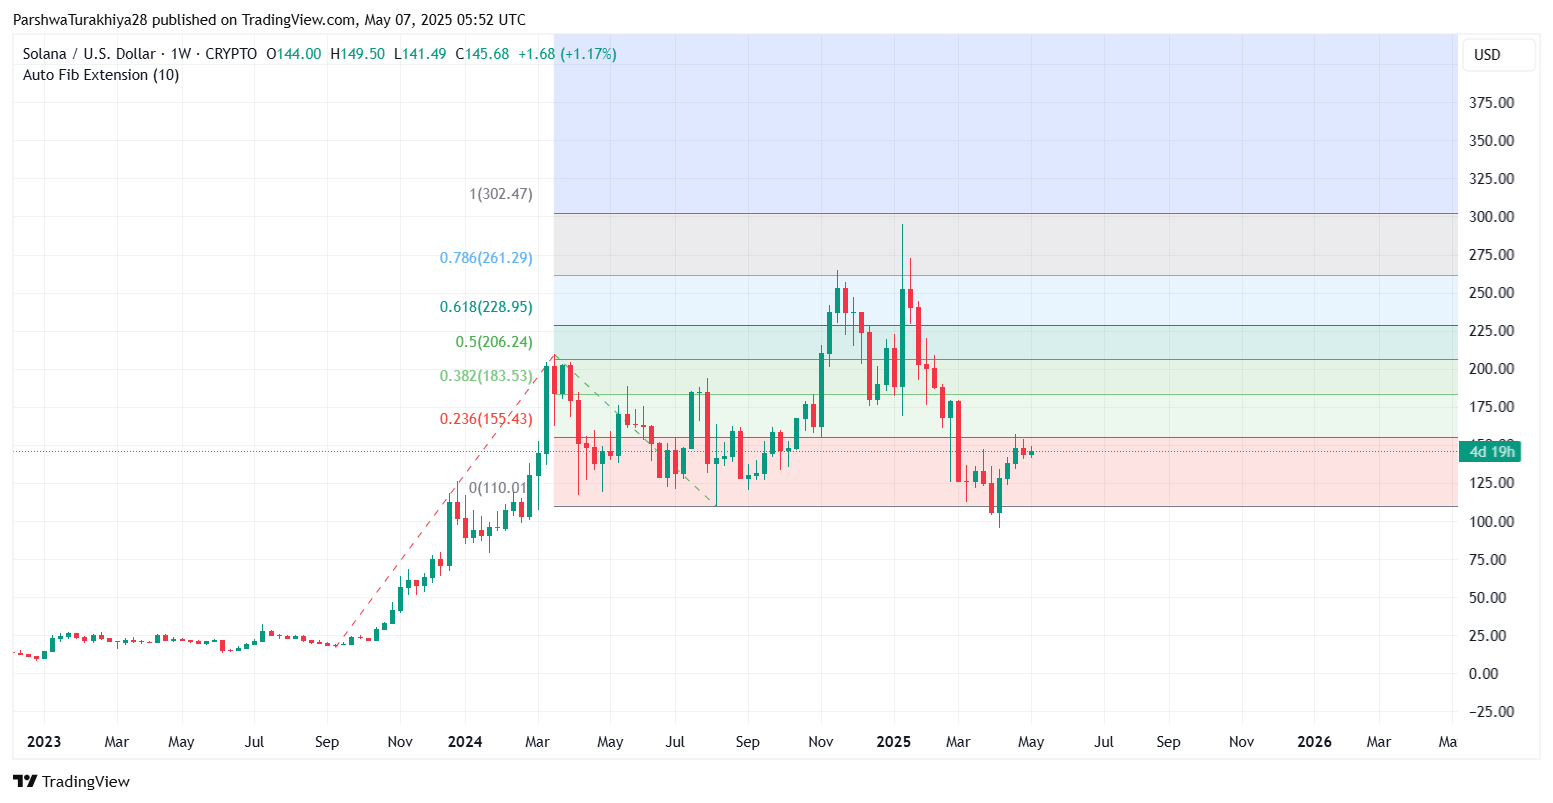
However, the broader Fibonacci framework shows that the major resistance is $183.53, 0.382. Additional resistance lines are drawn at $206.24 and $228.95, corresponding to the 0.5 and 0.618 retracement zones. These levels will be closely watched if the price closes above $155.43.
Solana is still one of the most volatile currencies, with descending resistance and low volume. With the bulls and bears waiting for a decisive move, it has become uncertain what the price direction will be.


