
- Bitcoin gained 6.97%, reaching $82,800.
- RSI climbed above 47.32, signaling a potential reversal.
- MACD shows reduced bearish momentum, pointing to possible continuation.
Bitcoin showed strong momentum on April 9, posting a sharp recovery from earlier losses. The daily candle closed at $82,245.70, gaining 6.77% in 24 hours. This rebound followed a recent low of $74,553.70, indicating a strong push by buyers to reclaim the $80,000 zone. Key indicators, including the Relative Strength Index (RSI) and the Moving Average Convergence Divergence (MACD), provided signals reflecting this momentum.
MACD Reads Negative as RSI Climbs Above Oversold
The MACD line was below the signal line and had a figure of -1,672.42 and -1,358.97. However, what the histogram printed was smaller red bars showing that the bearish pressure discouraged was fading. Later on, the MACD line approached the signal line, and there was a decrease in the distance between both lines.
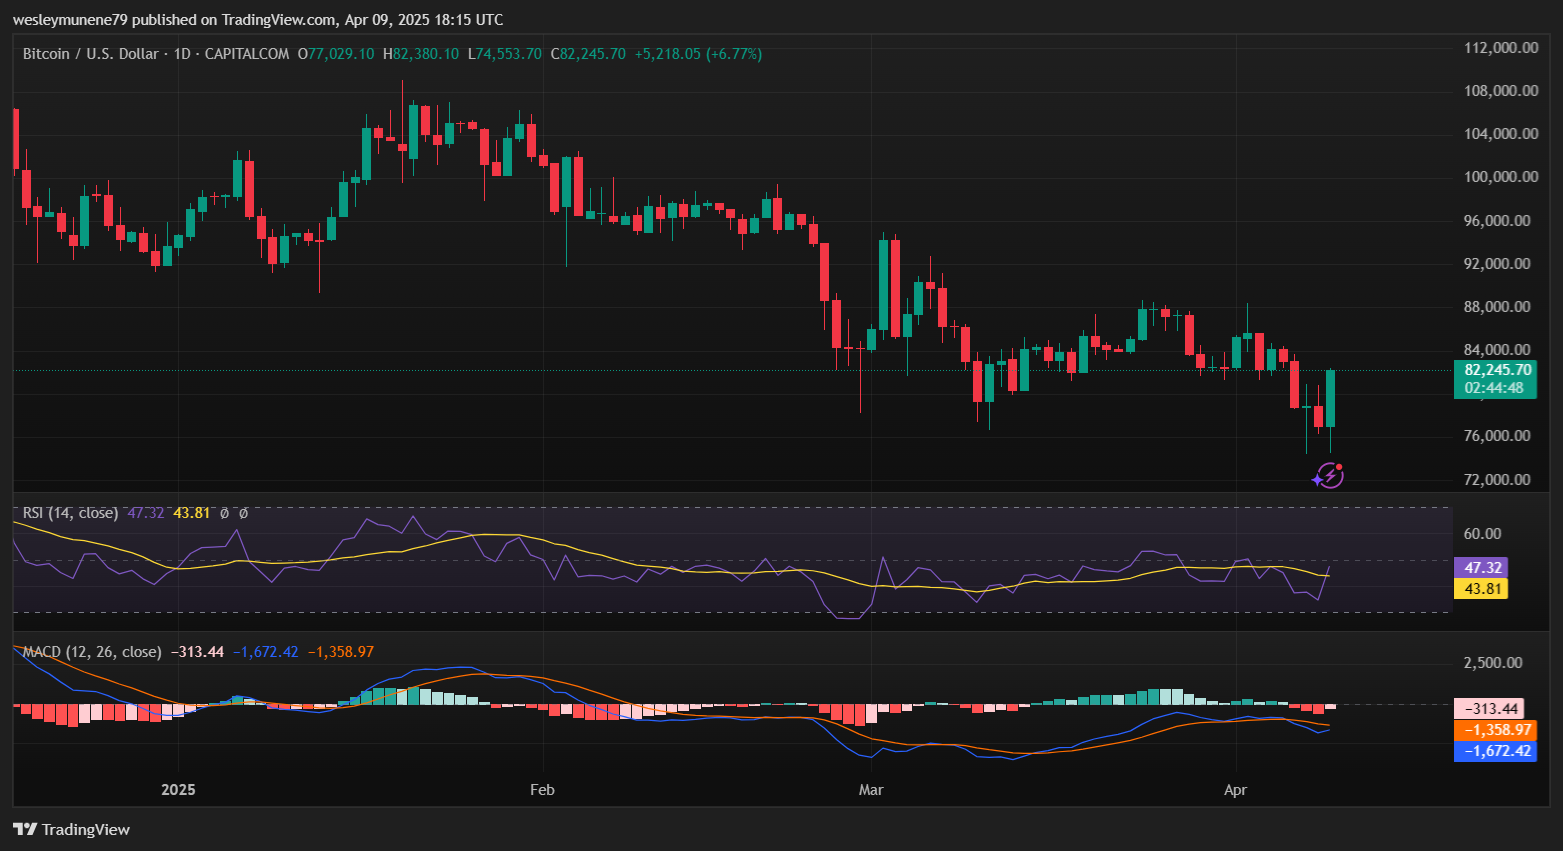
The histogram of the MACD was negative and had a value of -313.44, which is below the previous session, reflecting reduced downward strength. The divergence of MACD lines pointed to a turning point since the distance between them gradually decreased.
The RSI stood at 47.32, moving above its moving average of 43.81. This uptick followed a bounce from near the 30 level, a range often watched for reversals.
BTC reclaimed the $80,000 level after falling to the nearly $74,000 mark this week. Thus, $80,000 is a psychological level. This could point the next directional move if it holds above this range. The RSI and MACD show possible upside continuation. However, sustained movement will only depend on whether a buying pressure is above critical thresholds.
Bitcoin Current Market Movement Revealed
According to CoinMarketCap data at the time of press, Bitcoin traded at $82,800.24 on April 9, gaining 6.97% over the past 24 hours. The daily volume reached $73.26 billion, rising 51.85% within the same period. Market capitalization stood at $1.64 trillion after a 6.89% increase. The fully diluted valuation remained at $1.73 trillion. Circulating supply held steady at 19.84 million BTC against a maximum supply of 21 million BTC.
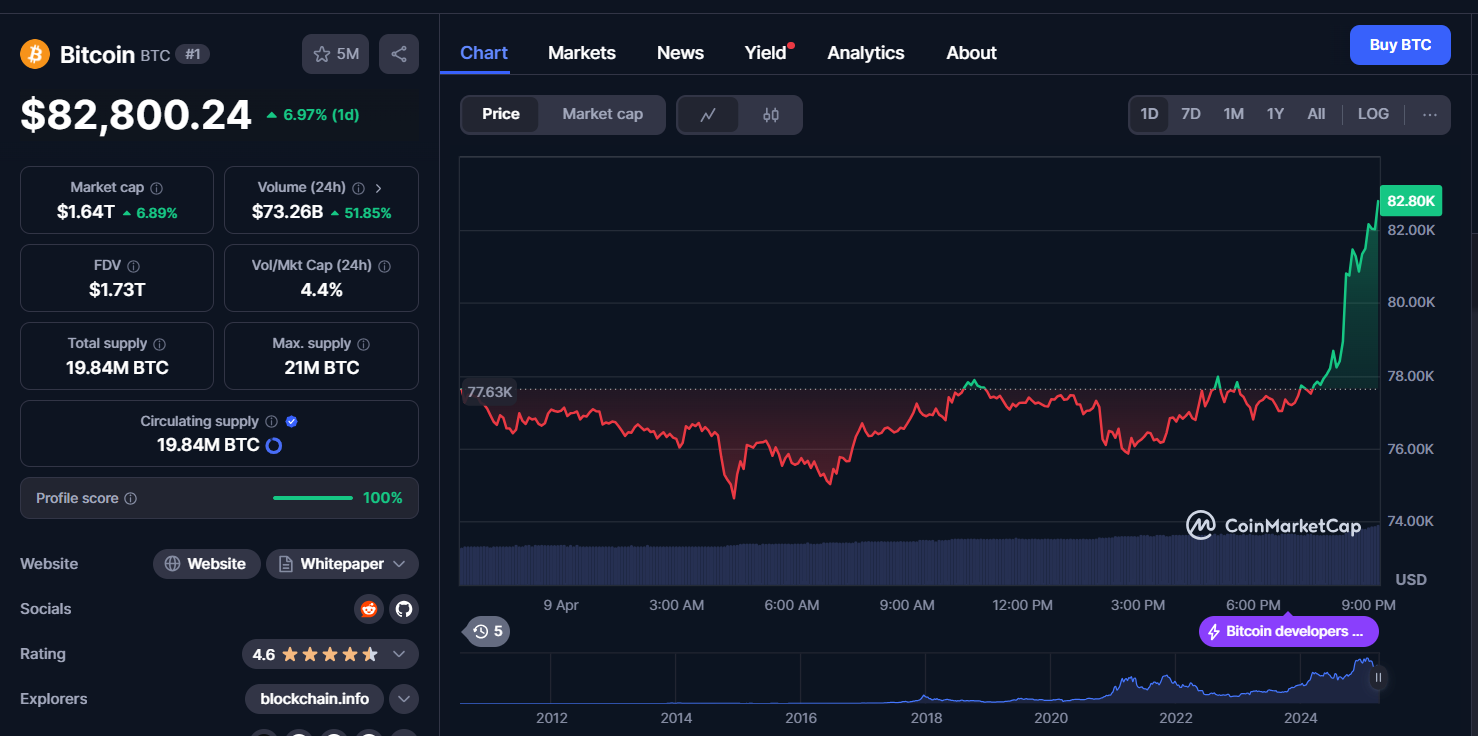
The volume to market cap ratio for the day was 4.4%, this proves the high market activity witnessed during trading session. Right after this mark, the price began to increase, after it had earlier dropped, around 6:00 PM UTC onwards. Bitcoin rose back above $76,000, and breached $82,000.
In the hourly chart, it has been observed that the asset was quite bullish with less fluctuation during the course of an hour. The prices of individual stocks also exhibited a similar trend and the price structure prevailed as bullish all through the observed period. This was further indicated in the 24 hours price chart by continued uptrend velocity and buying pressure until the late trading period.


