
- Bitcoin broke above $95,100, boosting bullish momentum and 2025 bull cycle hopes.
- $1.86 billion in BTC accumulation and strong technicals point to targets of $102,500–$119,500.
- A drop below $93,600 could trigger a pullback to $88,615, requiring close market monitoring.
Bitcoin rallied on Sunday, April 27, after it struggled to retain the $93,000 mark on Saturday and Sunday at a time when it had spent the weekend consolidating around that level. The renewed buying activity has resuscitated the broader cryptocurrency market and moved Bitcoin’s momentum decisively to the bullish side. Investors have been injected with fresh optimism from the breakout and hope the 2025 bull cycle may continue.
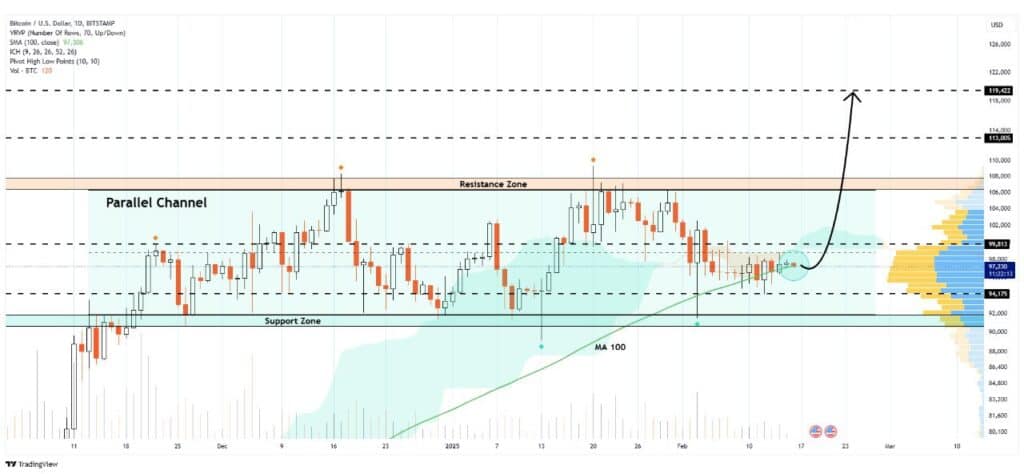
Bitcoin’s remaining confined within a horizontal channel on the daily chart is a pattern historically linked to major price moves. Whales_Crypto_Trading analysts point out that if the $100K level can be broken out of, it should push the pair to the upside firmly towards $119,500. Bitcoin has tightened its range as investors close in on the next significant price movement of the asset.
Short-Term Holder Basis Climbs to $93,000
This data from Santiment shows that the traders hoarded 20,000 BTC worth close to $1.86 billion in just 48 hours. The significant accumulation highlighted in this phase shows increasing market confidence and a solid base for more expansion in the future. They say the buying surge could be a fuse to Bitcoin’s future upside in the near term.
Technical indicators also support the strengthening bullish case. Bitcoin’s trading price is $93,145, which is the Short Term Holder (STH) Cost Basis, a crucial level. This metric has a broader range from $71,150 to $131,800 and provides useful benchmarks to the market. In the past, if trading sustained above the STH basis, it was an indicator of ongoing bullish local market activity from the most actively engaged market participants.
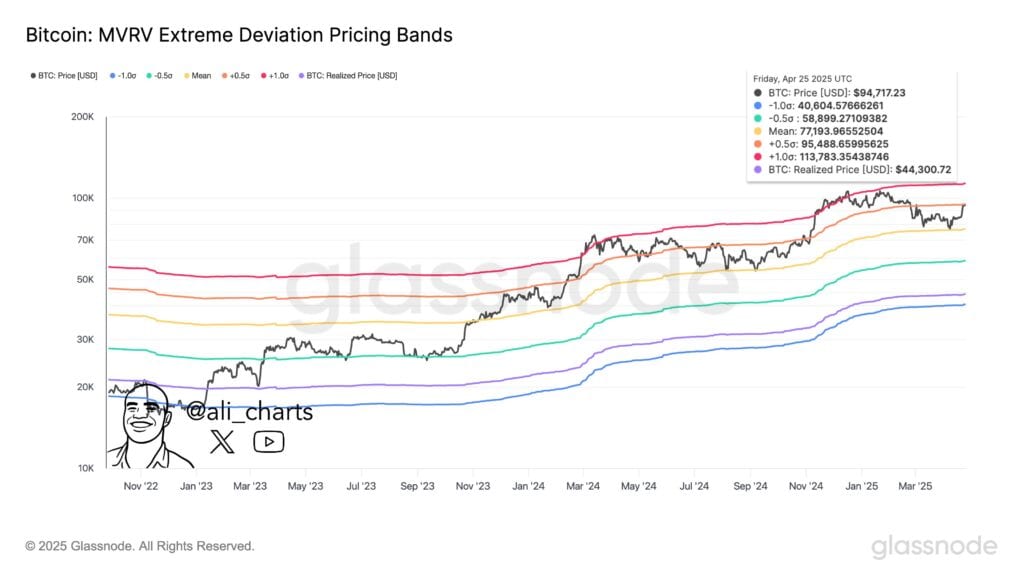
Crypto analyst Ali Martinez also pointed out that if Bitcoin breaks out and holds above the $95,500 level, the MVRV model can model Bitcoin up to $113,800.
Bitcoin Price Outlook: Targeting $119,500
Further, the bullish sentiment on BTC rises as the daily close sat above $94,400. The current ongoing expansion of the Keltner Channel further indicates the rising price momentum. If that buying pressure holds up over several sessions, there may be a run to $102,500.
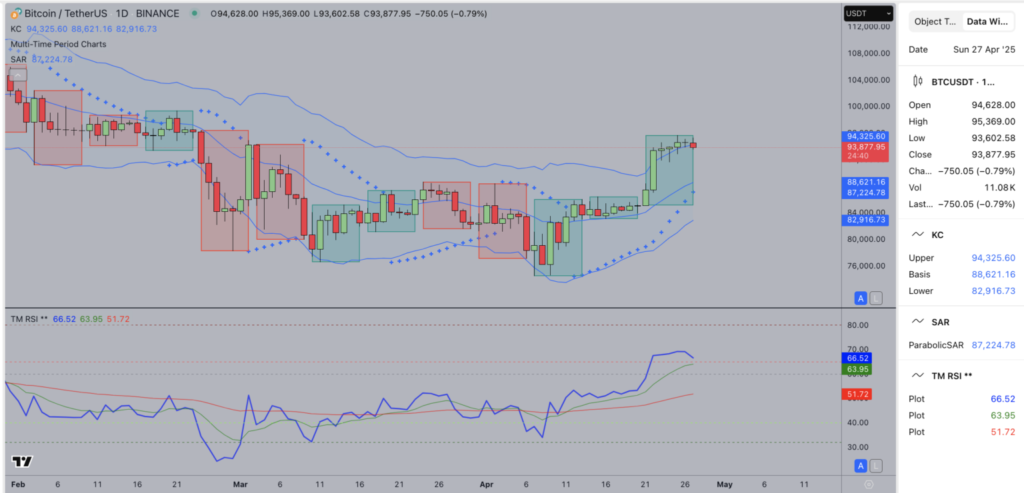
The Parabolic SAR indicator is also a strong positive indicator of continued bullishness, as it is below the current price at the dollar level of $87,224.78. Meanwhile, the TM RSI level is 66.31 and still comfortably below the critical 70 overbought threshold, meaning there is more room for this Bitcoin to climb higher before facing the main obstacle.
However, caution remains warranted. If BTC does not hold intraday support at $93,600, a reversal back to the Keltner basis line at $88,615 seems possible. In terms of technicals, analysts advise investors to keep an eye on these key levels as Bitcoin makes its way to this important juncture in its price action to manage the appropriate exposure.


