
- Bitcoin nears $100K as bulls break key resistance, backed by institutional inflows and rising market confidence.
- Over 66% of BTC holders are in profit, with on-chain data revealing strong support below current levels.
- A short squeeze looms as $3B in short positions cluster between $96.7K–$100K, potentially fueling a breakout.
As of May 2, Bitcoin (BTC) has continued its upward trajectory, reaching $96,926 today, marking a 0.51% increase over the past 24 hours. This surge is attributed to significant institutional investments and favorable technical indicators.
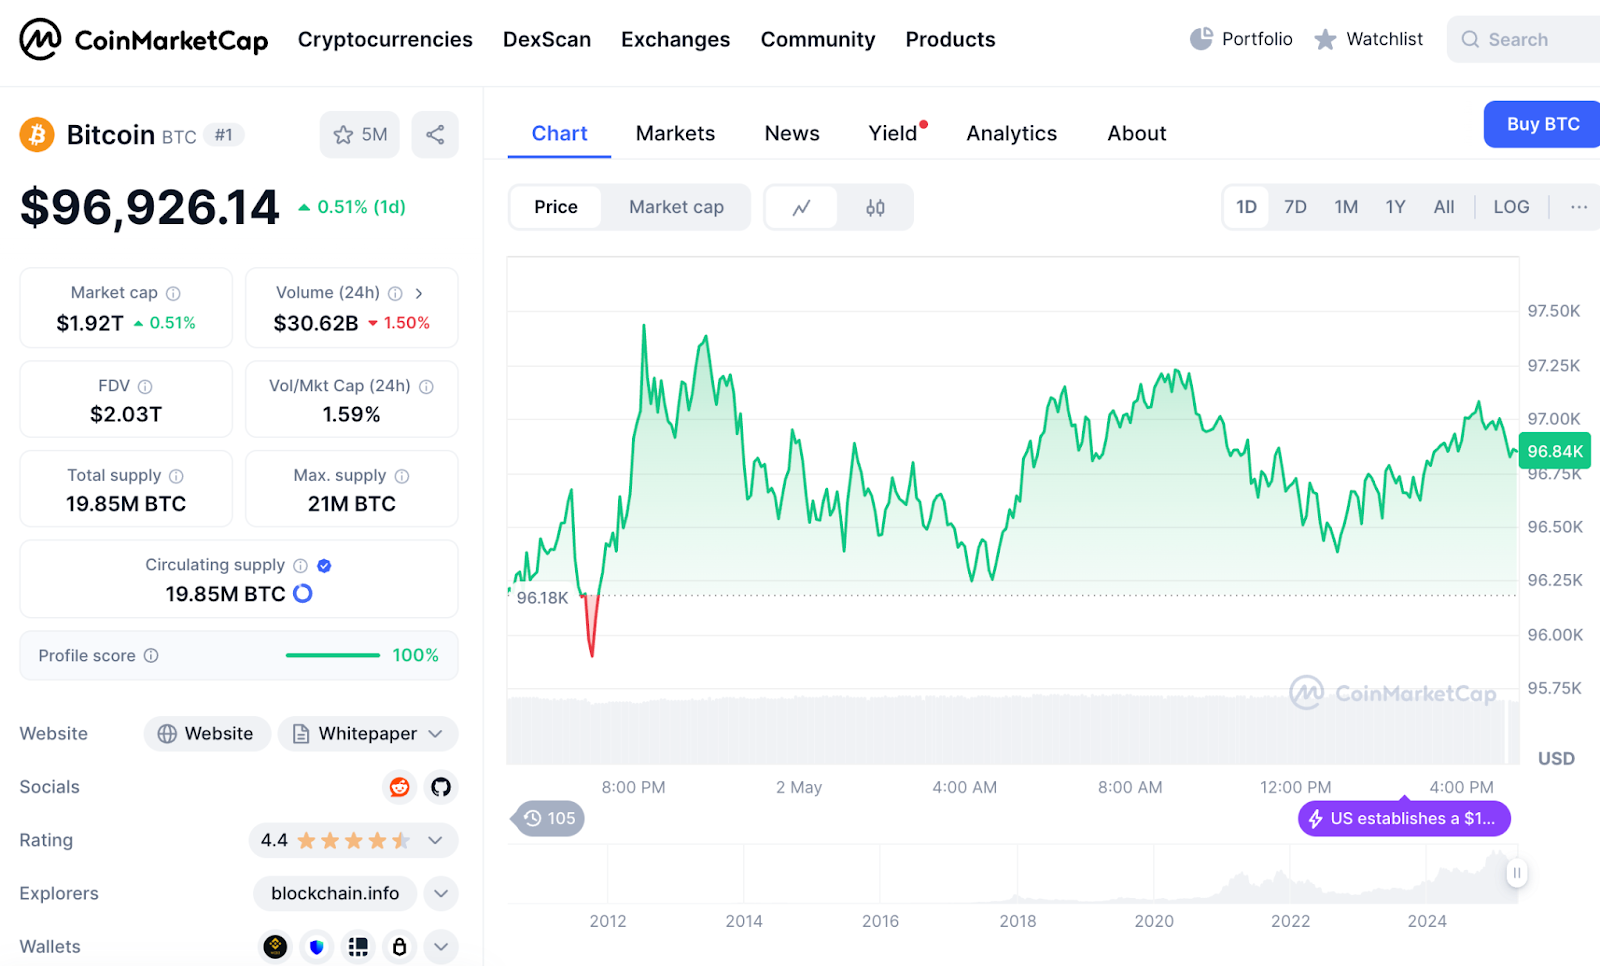
There has been recent growth in institutional inflow into Bitcoin. Meanwhile, an institutional investor is increasingly confident and places considerable assets in BlackRock’s IBIT fund, which has more than $43 billion in assets. For example, Strategy, led by Michael Saylor, announced that it is going to buy more Bitcoin through $21 billion equity offering, alluding to strong institutional interest.
Bitcoin Holders Mostly in Profit as Key Resistance Approaches
Crypto analyst Ali Martinez recently shared his Bitcoin’s current market structure chart analysis in which a strong majority of holders are said to be sitting in profit. In ‘In/Out of the Money Around Price’, shows how Bitcoin wallet addresses are distributed by their historical purchase price with respect to current $96,644.58 price.
It’s evident in the chart that 66.55% of Bitcoin addresses in possession of about 3.38 million BTC are in the positive. There is a large cluster of these addresses (2.13 million) that entered holdings between $93,697.86 and $96,582.51 at an average entry price of $95,068.12. A 1.47 million address group came in between $82,052.41 and $85,043.90 that was totalling 694.28k BTC. This layer of support suggests support on the market below the current price, this wide base of holders in profit contributes to overall market strength.
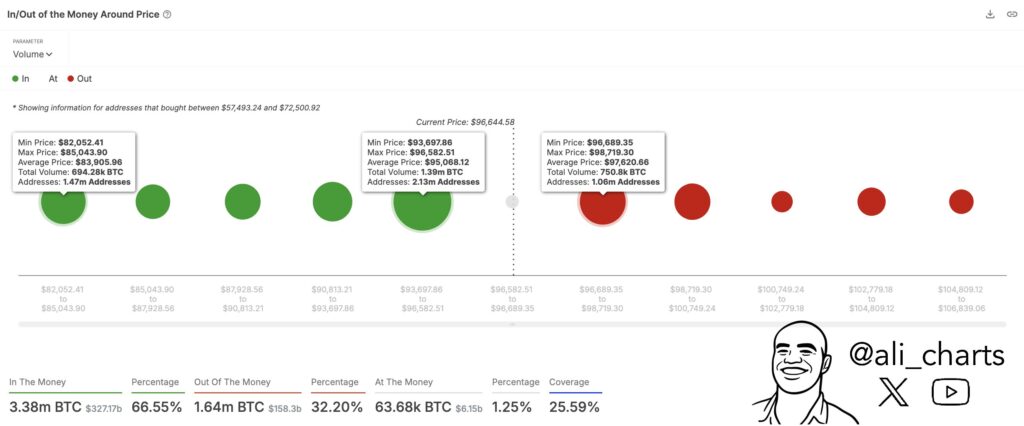
There 1.25% of addresses with 63.68k BTC, are ‘at the money’, meaning they purchased close to the current trading level. This would make these holders potentially reactive to short-term fluctuations and hence increase the volatility of the markets. However, there are 32.20 BTC out of 1.64 million registered addresses are currently at a loss. It’s worth noting that there exists a very important resistance zone located just above the current market price, where 1.06 million addresses purchased 750.8k BTC between $96,689.35 and $98,719.30. These investors could sell the very same day they break even, which could be this small zone bound to sell into.
If anything, this distribution in general points to Bitcoin at an absolute threshold. It could see selling pressure subdued if the $98,700 level can be broken through and permit a shot at the $100,000 mark. However, the lack of that could lead to consolidation or a short term correction.
Bitcoin’s Bull Score Surpasses 60 and Nears 80
A recent CryptoQuant chart shows Bitcoin’s Bull Score Index holding near 80, signaling strong bullish momentum. The Bull Score represents market sentiment from 0 to 100 that is above 60 when up. The index has been consistently high since the beginning of 2024, consistent with Bitcoin has flashed to over $100,000.

Looking at patterns on the chart as they appeared in the past, the previous peaks in the Bull Score always preceded a pretty large price rally. For example, scores that went high in late 2020 and early 2021 mirrored the ascent of Bitcoin to then record highs above $60,000. During 2022, the Bull Score saw a sharp dip to match the market-wide bear cycle penetration that bottomed out in the low $20K region.
Key Liquidation Zone Between $96,700 and $100K Could Trigger BTC Rally
A recent Bitcoin Exchange Liquidation Map from Crypto Rover highlights a potential short squeeze scenario as BTC trades around $96,105. As can be seen from the chart there is major buildup of short liquidation leverge above the current price of $3 billion, which is a very strong signal that if price rises above this level, many traders will be forced to short-defend this to a positive price action, which might not happen well and cause prices to move higher.
Binance, OKX, and ByBit cumulates liquidation data, and large volumes of short positions in the clusters with $96,700 to $100,000 are liquidating. A sharp rally on Bitcoin could follow if the zone is broken, if forced buybacks happen.
Previous liquidations cleared short-term resistance in liquidation spikes earlier at $83,000 and up to $88,000. But with all the leverage that is currently available, rejection could also cause a pullback.
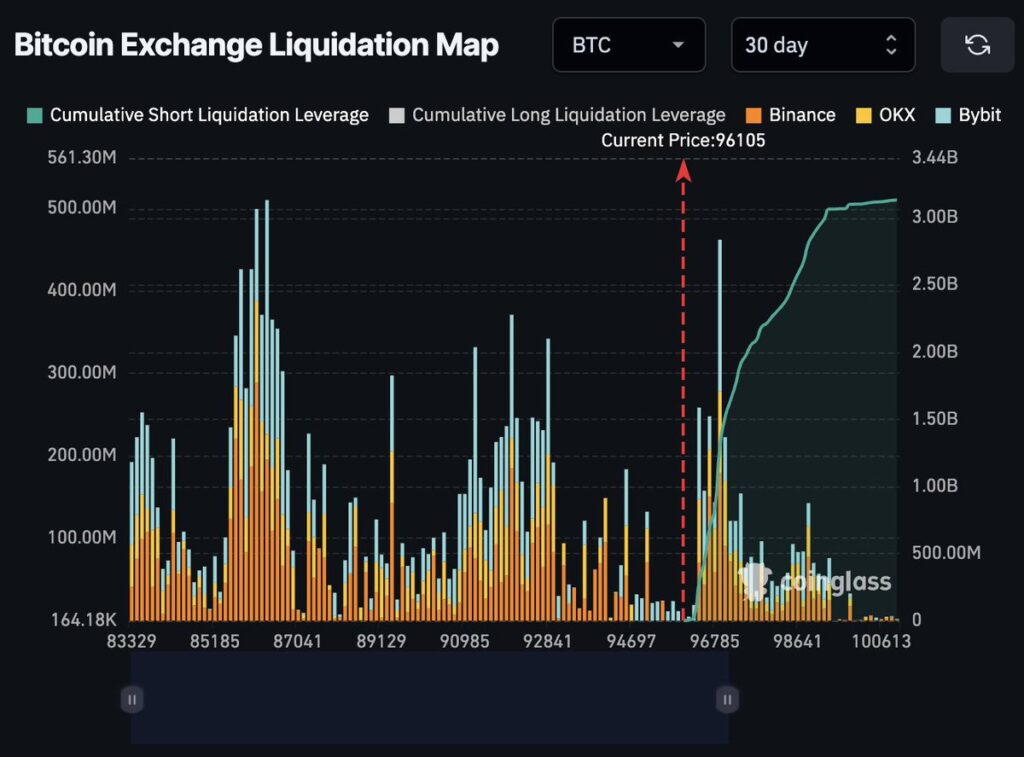
In general, Bitcoin now occupies a very critical moment in time. If BTC can break out above $96.700, this could spark a powerful short squeeze which could also send Bitcoin close to $100.000.
Bitcoin Breaks Out of Megaphone Pattern, Targets $107,100
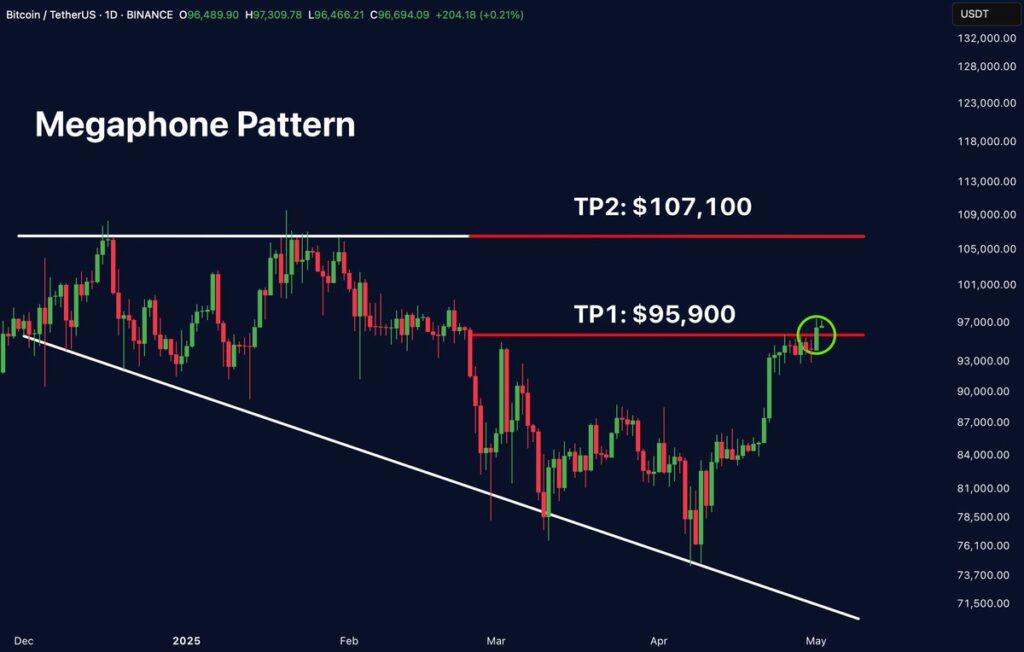
According to Merlijn The Trader, a prominent Bitcoin trader, Bitcoin appears to have broken out of a megaphone pattern, signaling the potential for continued upward momentum. According to him, seeing Bitcoin trading at roughly $96,694 shows that it can break the important resistance at $95,900 now marked as a first target (TP1) in the chart.
It is a megaphone pattern posing a broadening formation. More volatile price swings occur, and after the breakout, it leads to a strong directional motion. If bullish momentum holds, the next major resistance level lies at $107,100 and TP2 stands at 107,100 as well. If $95,900 is successfully retested and held, a breakout and subsequent path to this upper target could be on the cards.


