
- Cardano (ADA) eyes a 27% breakout as it surges above key resistance. Weekly chart shows bullish MACD and cloud support signal more upside.
- ADA breaks out from symmetrical triangle pattern with rising volume. Bullish MACD crossover and RSI above 50 hint at trend reversal.
- Cardano’s $0.65 breakout sparks bullish sentiment. Volume jumps 21.63% and MACD confirms momentum shift as liquidations fuel volatility.
Cardano (ADA) presents favorable market conditions on its weekly chart driven by major fundamental indicators that maintain its position. The price remains above the cloud indicating continued upward movement while forming strong support at $0.545. A fresh market signal “green twist,” has recently developed in trading history. Assessors observe this pattern when Senkou Span A exceeds Senkou Span B, and resting above the cloud indicates ongoing upward price movement.
The Moving Average Convergence Divergence indicator supports the bullish outlook on investments. The MACD signal indicates a positive histogram while the lines prepare for a crossover with the signal line. This development on the weekly timeframe points to a potential shift in momentum toward the upside. An upward price movement seems possible because these specific technical indicators align to suggest this outcome.
Breakout from Symmetrical Triangle Highlights Market Activity
Market analyst Ali reveals a major technical breakout through ADA’s indicator chart. Cardano experienced price consolidation inside a symmetrical triangle pattern according to his expert evaluation. The price compression within this pattern proved essential to identify impending larger trends by defining potential swing movements. Analysis of the pattern height indicates a projected move should reach approximately 27%.
The upward breakout from this pattern now maintains its position which validates the technical indicator and shows enhanced market buying activity. The price action proved to exceed the upper boundary of the triangle pattern which shows strengthening buying momentum. ADA’s continued price rise beyond $0.65 resistance depends on its ability to keep above the existing trading barriers. asic pattern validation depends on price retention above $0.65 which will create options for ADA to move toward its projected target.
Daily Chart Supports Trend Reversal
The daily Cardano price movement follows general bullish market indicators. The ADA pair traded at $0.650 to achieve a 4.17% daily return. The current price fell to $0.620 before executing a sharp recovery which left the market near its daily peak level. The price movement shows signs of a possible trend shift because it came down from its peak.location at $1.20.
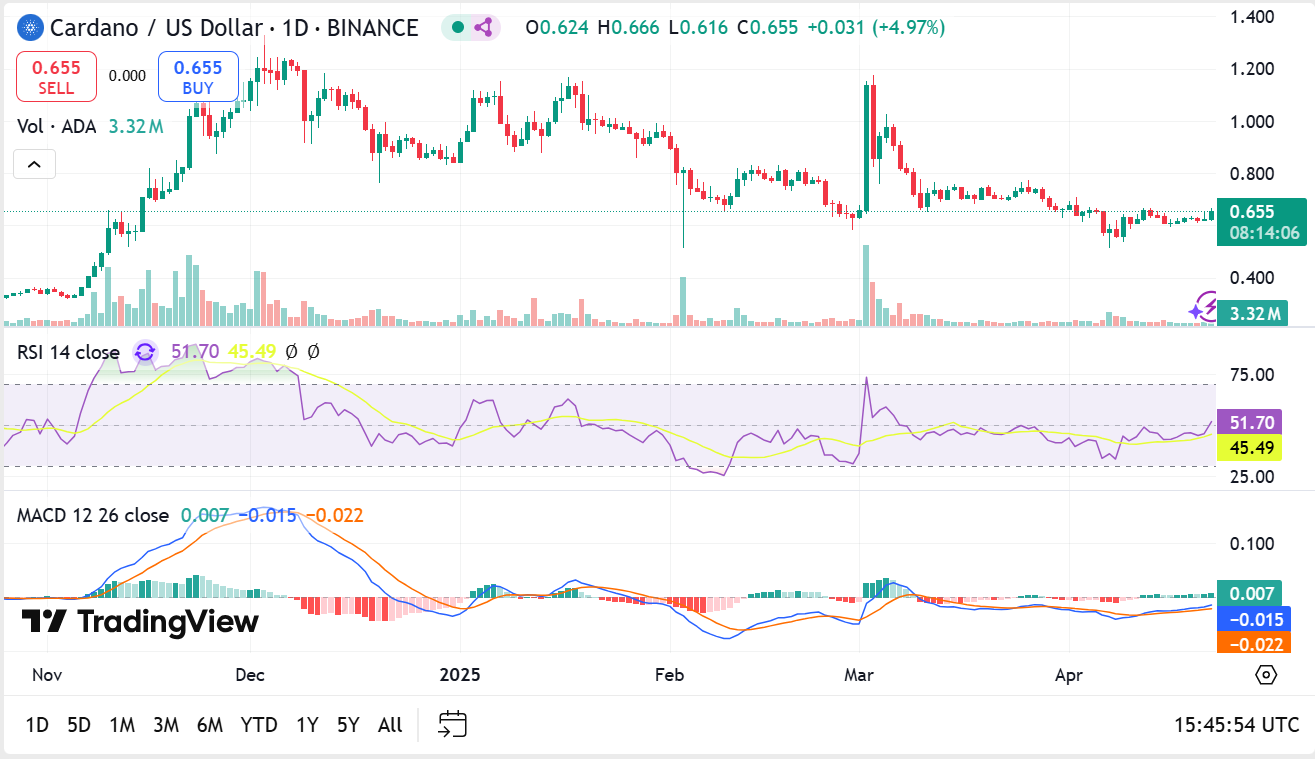
Source: Tradingview
The Relative Strength Index stands at 50.83 points above the 50 mark. The statistics signal the beginning of bullish market behavior. The daily MACD indicators display positive crossover potential because the green histogram bars are increasing and the MACD line approaches the signal line. The data provides evidence that ADA moves toward a distinct upward price stage.
Volume and Liquidations Reflect Market Participation
The trading volume reached $2.48 million on the breakout day. Market interest in the asset is increasing based on current trading data which shows figures slightly lower than peak values from previous major price movements. Trading volume has soared 21.63% within the previous day according to on-chain data which demonstrates rising investor attention.
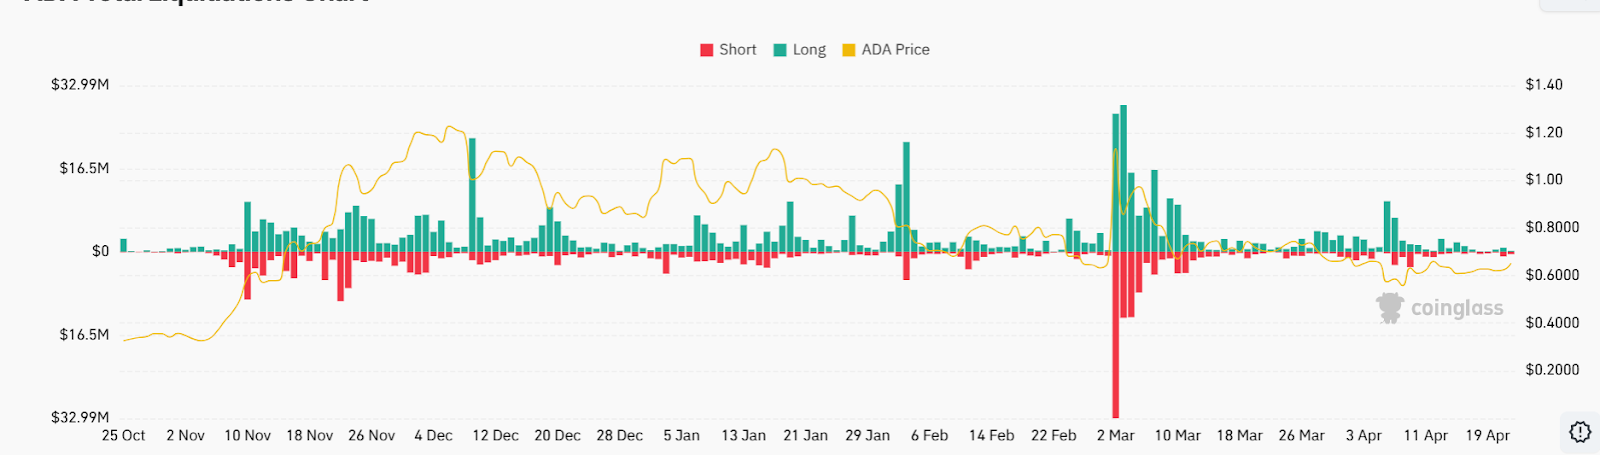
Source: Coinglass
The prices of ADA indicate ongoing fluctuations that result in frequent liquidations of traders using both long and short positions. Short sellers faced a major squeeze of ADA positions in early March and December produced heavy liquidations among traders who bet on price increases. The rapid price movements cause these particular patterns in the leveraged trading sector. Prices breaking out of consolidation zones trigger liquidations that intensify price movements between two directions.


