
- BTC breaks consolidation, eyeing $100K as volume and sentiment strengthen.
- ETH forms a double bottom, signaling bullish momentum and renewed investor interest.
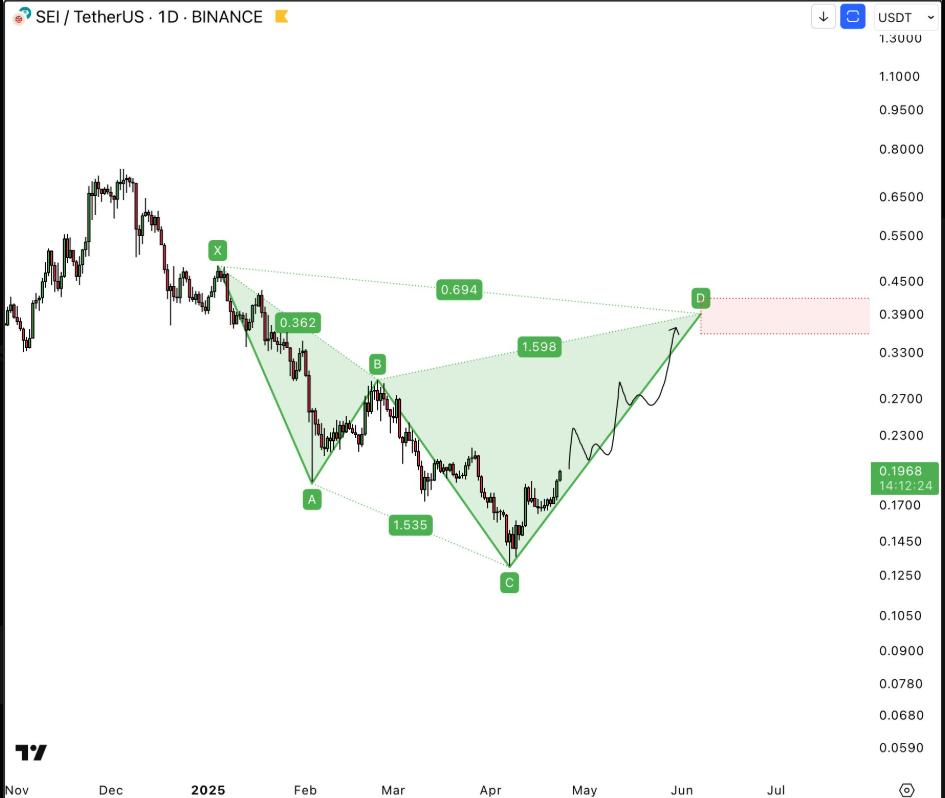
- SEI spikes over 6%, backed by a bullish Gartley pattern and 101% volume increase.
As the crypto market heats up, major players like Bitcoin, Ethereum, and emerging tokens like SEI are making waves with strong bullish momentum and promising technical setups. Investor sentiment appears to be shifting toward optimism, fueled by key breakouts, surging volumes, and powerful chart patterns. From Bitcoin’s potential rally toward $100K to Ethereum’s bullish reversal and SEI’s harmonic climb, traders are eyeing critical levels that could define the next phase of the bull run. Here’s a deep dive into the latest price movements and expert analyses shaping the crypto landscape.
Bitcoin (BTC)
Bitcoin continues its upward momentum, reaching $93,948.00 with a 2.73% gain over the past 24 hours, according to the latest data from CoinMarketCap. The leading cryptocurrency now holds a market capitalization of $1.86 trillion, bolstered by a significant 22.79% increase in 24-hour trading volume, which surged to $53.09 billion.This price chart reveals a sharp rise, which was around $91.250 at the beginning of April 23, before it slightly oscillated up and down, still with the overall bullish trend. Circulating supply for Bitcoin has been at 19.85m, capped on a maximum attainable 21 million, and this rigidity of supply continues to fuel investment when people are already getting into the crypto market that is recovering and is in its early stages.
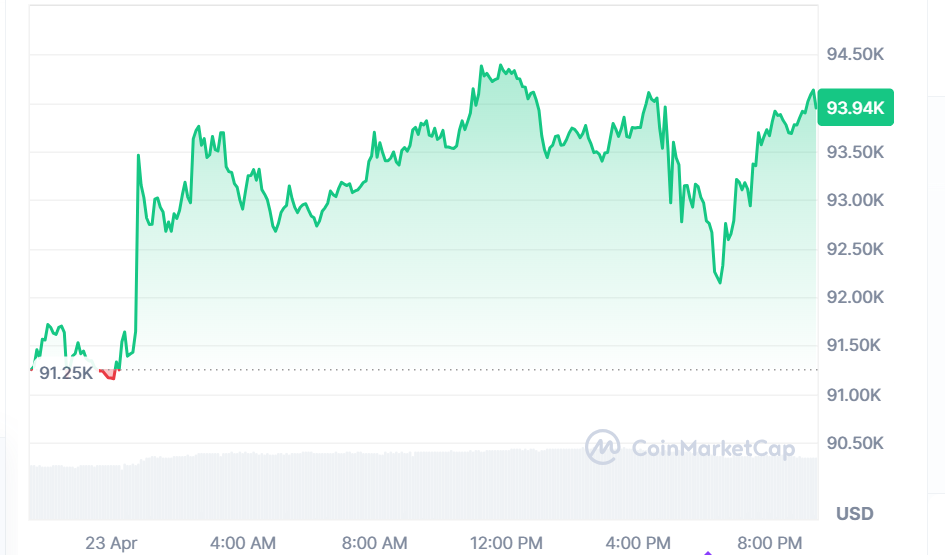
Source: Coinmarketcap
According to Mister Crypto, Bitcoin has officially broken out of a prolonged consolidation phase, signaling a potential bullish continuation after months of downward pressure. The chart boundaries look like a falling wedge pattern, which is usually a buy signal and at the moment, Bitcoin has a bullish candle. The single solid circle green barely illustrates the breakout that has navigated past the important area around $86,500, marking an intense change of overall market sentiment. The successful breakout gives the bullish trend confirmation and signals that the altcoin’s path to $100,000 and above may be realized in the following weeks.
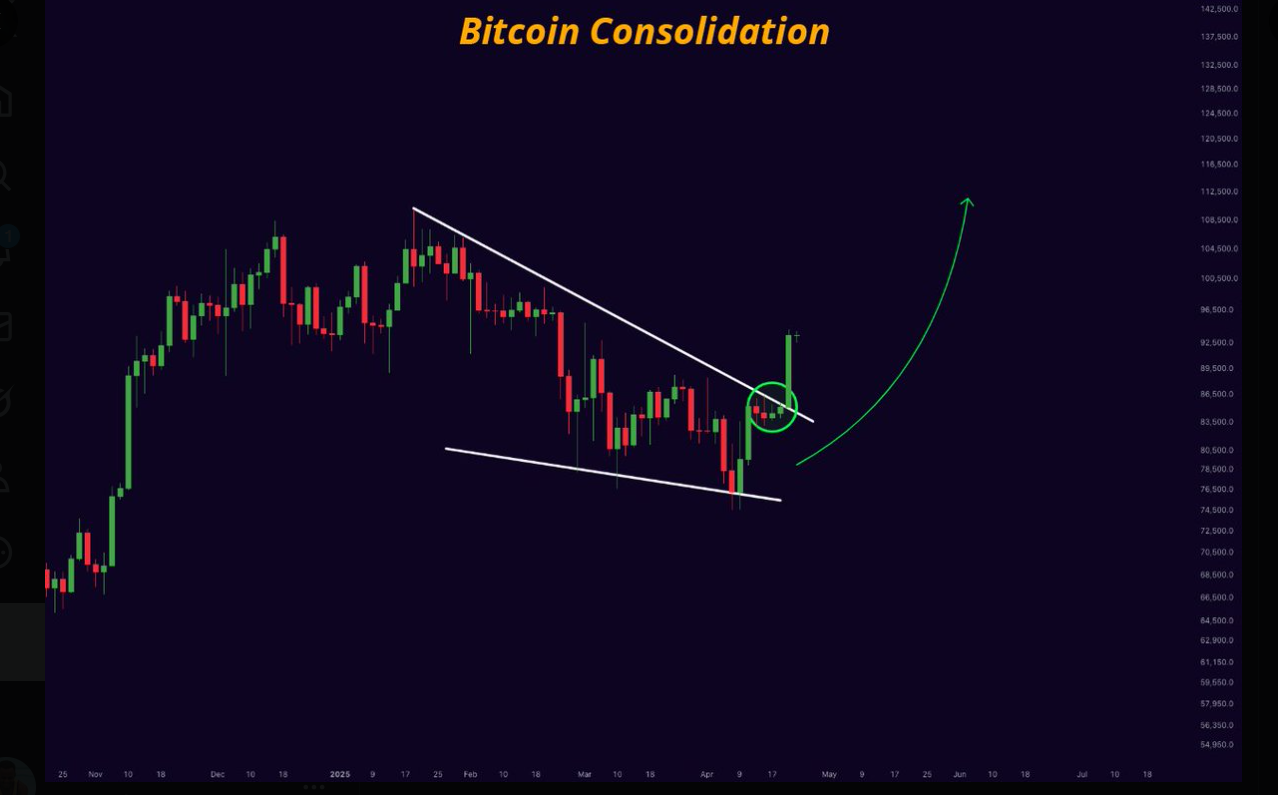
Source : X
Ethereum (ETH)
The Ethereum (ETH) price chart shows a strong bullish trend over the past day, with the price rising 5.89% to $1,807.5.With their starting value of around $1,698.3, the prices rise significantly immediately at the beginning of the hours and have remained extremely volatile in the process which reaching high values of more than $1,825 for intraday before they slightly dropped. A rise of 32.39% in the overall trading volume to $ 26.02B points towards a more active market and higher investors’ participation. This can be attributed to another increase in the value of Ethereum since it registered a 6.12% increase in its market capitalization to $ 216.43 B. For both total and circulating supply, the values are at 120,71M ETH, while there is no max supply to amaze at, provided that Ethereum has embraced an issuance model after the merge.

Source : Coinmarketcap
According to CryptoELiTES, Ethereum (ETH) appears to be forming a bullish reversal pattern, as indicated by the chart showing a potential double-bottom structure supported by a consistent ascending trendline. The chart suggests ETH has tested this trendline support multiple times and successfully bounced off it, signaling a possible upward momentum. ETH, which reached a low of $302.8, is also indicating a recovery from this low; hence, analysts are expecting a bullish run. The formation of the rounded top and the paths of the arrows also point to technical analysis of further upward movement, and if the volume and buying pressure increase, then there may be a breakthrough or testing of the new upper resistance areas near previous peaks.
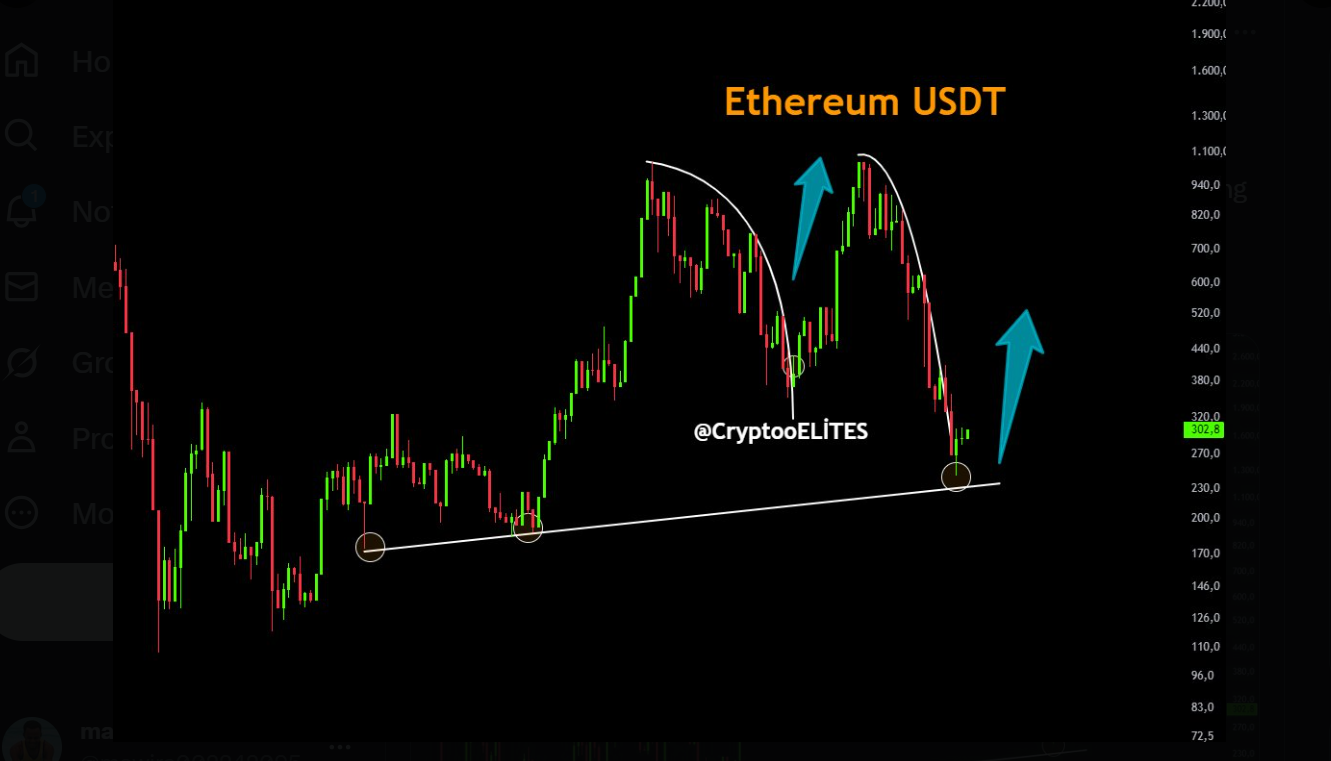
Source : X
Sei (SEI)
Sei (SEI) is experiencing a strong bullish surge, climbing 6.55% in the past 24 hours to $0.1967, according to CoinMarketCap.The token’s market capitalization has now crossed the $1 billion mark and is standing at $994.78 million; the trading volume has increased by as much as 101.38% to $126.62 million, reflecting the rising interest of investors. The price chart it shows a progressive increase from an intraday low of $0.1826, hence having an upward turn with oscillating corrective bounce. Currently standing at 5.1 billion SEI out of a total of 10 billion, the asset has attracted attention for registering high volumes against the total market capitalization of 12.72%, which implies high activity in comparison to market capitalization.
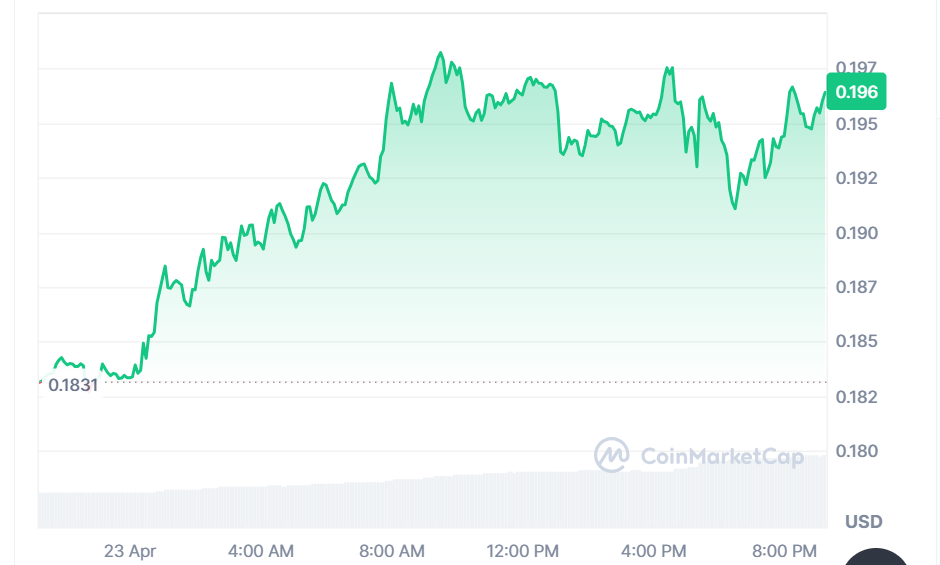
Source : Coinmarketcap
According to Shelby, SEI appears to be forming a bullish harmonic pattern, specifically a bullish Gartley, suggesting a potential reversal and continuation of the uptrend. This is a clean XABCD formation, and the pair is charting a course toward the vital ‘D’ area near $038.40-$0.45 presently. As can be seen from the figure below, SEI has been enjoying the movement from the “C” point of round $0.13 to the current level of $0.1968, and if the assumption of a continuous rise is made based on the given pattern, then such a prediction could be made. If this structure is valid, the trades could anticipate a further bullish run towards June, which is a critical level of a possible breakout or reversal.
Source : X


