- Dogecoin’s chart resembles its 2020 breakout.
- Global liquidity is rising after a long pause.
- Momentum signals suggest a bullish reversal.
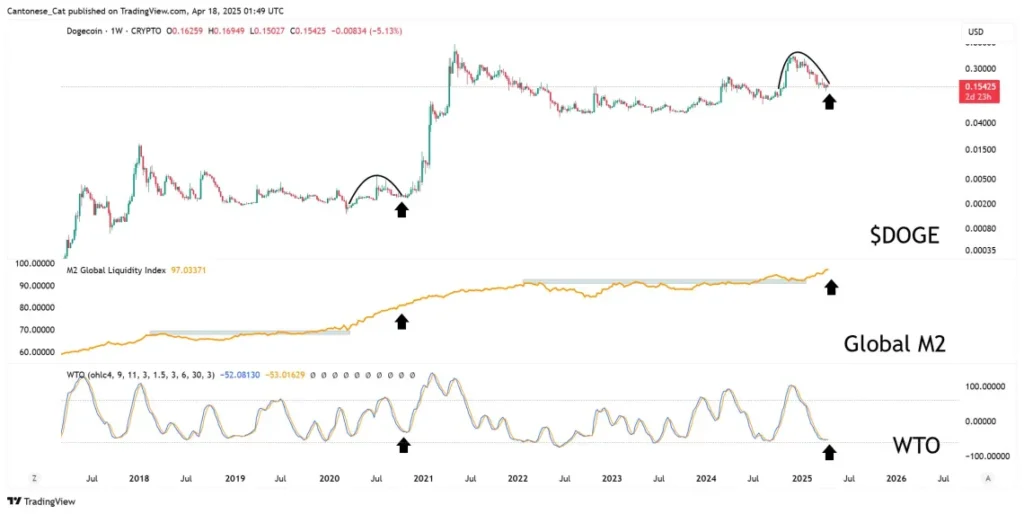
Despite Dogecoin’s slide, its weekly chart is starting to develop a familiar outlook, which is causing crypto-watching eyes to spark some optimism. Cantonese Cat, a pseudonym for a leading crypto data analyst known as @cantonmeow, has posted a three-panel composite analysis of the kind familiar just prior to the Dogecoin rally in 2020–2021.
All three are revealed in the graphic shared Friday on social platform X and include Dogecoin’s price movement, the Global M2 Liquidity Index, and the WaveTrend/Weighted Trend Oscillator (WTO). At the moment, each part looks awfully much like the configuration it stood shortly before DOGE began one upward sprint in late 2020, weeks before it reached its report top at $0.74 in May of 2021.
First is the upper panel’s weekly candles from 2017 through mid-April 2025. Currently, Dogecoin is trading at $0.154, which equates to a 68% drop from its peak December 2024 price of $0.484. The hand-drawn black arc indicates the ongoing pullback from December to now (April) and an arrow to a possible bottom at $0.13. Cantonese Cat used this particular visual format of a rounded pattern with the arrow ending in late 2020 when DOGE had made a vertical breakout.
Liquidity and Momentum Indicators Align for DOGE
The Global M2 Liquidity Index chart contains the central pane, which aggregates the broad money supply, consisting of cash, demand deposits, and near money equivalents, on a weighted basis of five major currencies: the U.S. dollar, euro, yen, pound, and yuan. The M2 index is widely used as a monetary measure of systemic liquidity; expansions usually draw capital to risk assets, while contractions generally stop such flow.
The index stayed sideways between 2022 and early 2025. But it is now shooting back up, breaking out of a multi-year stall and reading 97 on Cantonese Cat’s custom scale, a new high, indicating that the reawakened liquidity is reemerging.
The WaveTrend/Weighted Trend Oscillator, a momentum-based indicator commonly found on TradingView, was displayed on the lower panel. The WTO plots both a fast and a signal line within a ±100 range. When readings fall below 50, a market is said to be oversold, and bullish crossovers are typically an end to minor downside momentum and the beginning of a recovery.
Dogecoin’s Price Pattern Mirrors Previous Breakout
In December 2020, Dogecoin entered into price consolidation while the WTO hit a trough and went back into positive territory: this marks the end of Dogecoin’s price consolidation. The oscillator has been bottoming as of the past week, as when the fast line crosses above the signal line, the bears may be losing their momentum again.
The Cantonese Cat’s thesis depends on three converging signals Dogecoin’s price action is trading in a continuation pattern, global liquidity is trending to cycle highs, and internal momentum is transitioning from oversold to recovery mode. This was the last time these indicators aligned, when Dogecoin massively outperformed other major crypto over six months.
The commentator was not wrong when he said, ‘When it pumps, you’re in it for the tech.’ Though the branding has likely been of Doge as a meme, Doge still behaves more like a leveraged play on macro liquidity than a pure f’ing payments protocol. Combined with global liquidity returning to markets, the setup points toward another Dogecoin outperformance well in advance.
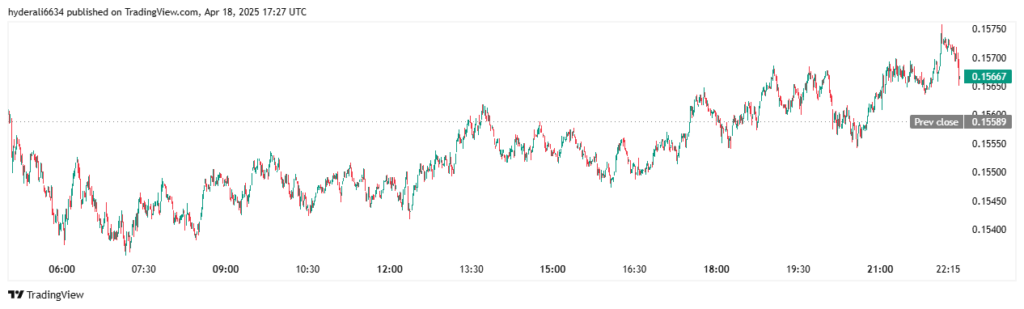
At the time of publication, Dogecoin was trading at $0.156


