
- DOGE holds key support with early bullish signs.
- Historical pattern hints at 500% price surge.
- ETF interest grows, a potential catalyst for a rally.
Dogecoin holders marked April 20 with celebrations for the annual DogeDay, a community-driven event that first gained mainstream popularity in 2021. However, beyond the festivities, fresh optimism is emerging in the Dogecoin camp as a prominent crypto analyst forecasts a potential 500% price surge based on a familiar historical setup observed during a previous bullish cycle.
Dogecoin Price Holds Strong at Key Support
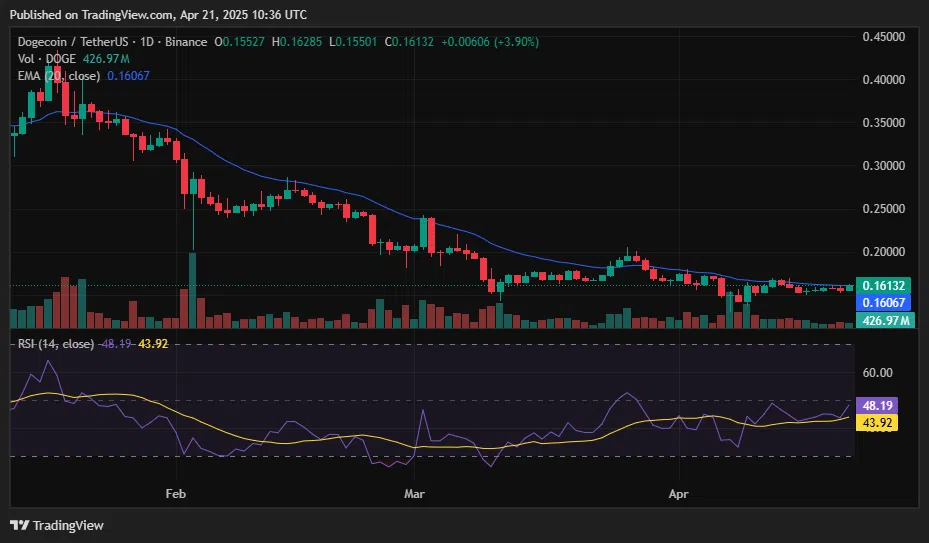
Dogecoin (DOGE) is currently trading at $0.16132 with support at a critical horizontal level. Since late March, Bitcoin SV has been confined in a tight sideways trading range between $0.14 and $0.16, as is often seen during an accumulation phase after a prolonged downtrend. Currently, the price is testing the 20-day Exponential Moving Average (EMA) at $0.16067, and the technical indicators indicate it is starting to approach its psychological resistance level of $0.20, which has been tested for the first time in early March and again at the end of that same month.
The Relative Strength Index (RSI) is bullish on the move above its moving average. Although it is still below the neutral 50 threshold, the indicator’s upward move indicates building positive momentum and the reinfusion of investor interest. However, the rest of the market structure remains bearish. Although the sentiment is changing, participation is still moderate, and there are no confirmations of a breakout above the 20-day EMA, so the price has not yet completed this task.
Historical Pattern Signals Possible 500% Dogecoin Surge
Even with bearish signs on the daily chart, crypto analyst @Steph_iscrypto says that there is a historical pattern which was seen in the past to generate a massive price rally. During the earlier cycle, the analyst notes DOGE experienced a 129-day downtrend, which popped almost 500% as it went from roughly $0.08 to greater than $0.40. With DOGE doing the same thing that the analyst notes is happening to it right now, the analyst points out that DOGE is now also on a 129-day decline once more. In both cases, the period was marked on the chart as 43 bars, 129d, which means 43 daily candles over the identical time frame.
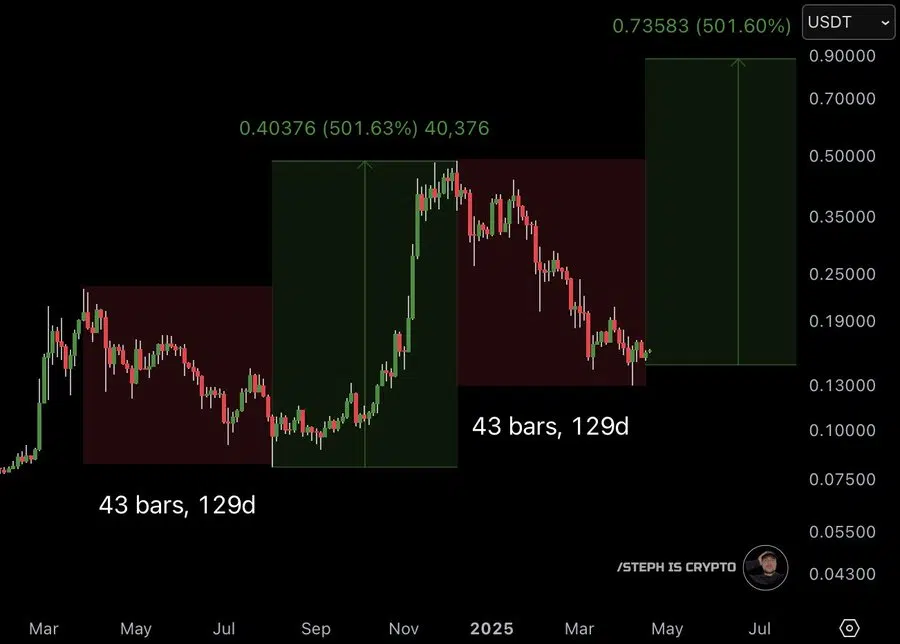
If this pattern holds, Steph_iscrypto suggests that the current consolidation could be used as the springboard for the next one. On April 19, he wrote on X that there is potential for a strong bullish reversal at “Bottom signal flashing.”
In that time, as Bitcoin soars higher, Dogecoin is seeing an increasing amount of institutional focus. Several exchange-traded funds (ETFs) designed to track the price of DOGE are currently being reviewed by the US Securities and Exchange Commission (SEC). In conjunction with Osprey Funds, asset managers have filed notable filings with Bitwise, Grayscale, 21Shares and Rex Shares. If any of these ETFs get approved, analysts say they could act as a powerful catalyst, driving the price beyond its current trajectory and aiding the 500% breakout scenario touted by @Steph_iscrypto.


