
- DOGE breaks out of bullish patterns signaling upward move
- Price may rise to $0.195 to $0.202 with up to 28 percent gain
- RSI MACD and volume support continued bullish trend
Dogecoin (DOGE) generated a major breakthrough, as its two critical technical indicators displayed potential changes in market sentiment. The DOGE/USDT daily chart displays an ascending triangle pattern, one of its major recognizable configurations. The ascending triangle pattern develops through rising trade lows that reach a horizontal resistance area, often indicating positive price action. DOGE surpassed the $0.168 resistance level, serving as the triangle limit to demonstrate potential for rising prices.
Analyst Ali shared his price prediction of $0.195 in a recent X post based on this price breakout. According to Fibonacci level indicator, price activity will likely keep rising in the short run. The technical confirmation of this trading breakout confirms bullish trends for investors to consider $0.195 as their resistance and profit point.
The one-day price chart shows a rising breakout from a falling wedge pattern. Breaking-out scenarios occur in falling wedge patterns because downward pressure briefly ends its movement as lines narrow.
A bullish candlestick moving above the upper trend line strongly confirms that an upward direction change may be occurring. According to the price projection after the breakout, Dogecoin has the potential to rise from $0.157 to $0.202, which represents a 28.48% positive change.
The projected price target marked by the green box implies a bullish move of approximately 28.48%, with the price potentially rising from around $0.157 to near $0.202. This breakout could signal the start of a significant upward wave, aligning with the tweet’s prediction of a “massive bullish wave soon.”
Market Performance Reflects Renewed Investor Interest
The price of Dogecoin currently stands at $0.1719, an 8.60% increase over the previous 24 hours. The price has mostly risen throughout the day after initiating trade at $0.1584 and exceeding $0.171 during its daily peak. The market performance demonstrates growing investor faith and rising market speed.
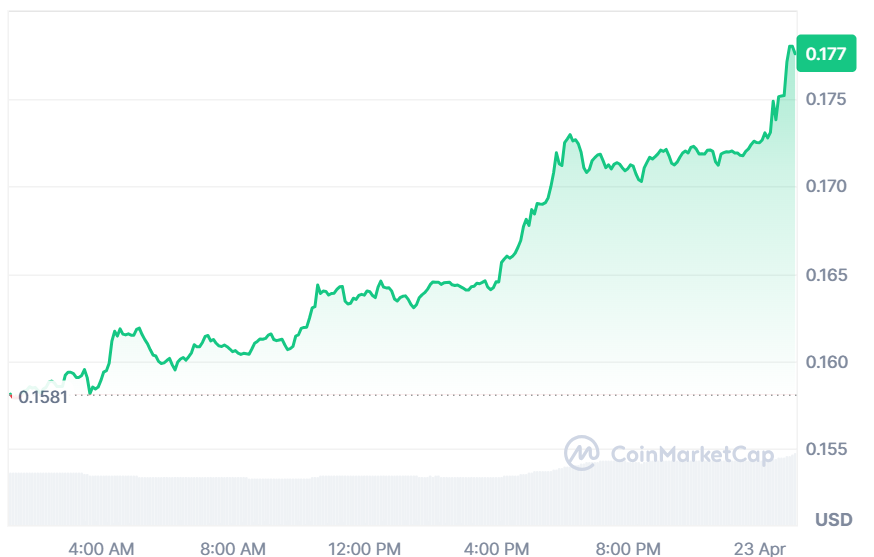
Source: Coinmarketcap
Current market capitalization for Dogecoin amounts to $25.61 billion while remaining as one of the most valuable cryptocurrencies regarding market capitalization. Traders and investors can easily access Dogecoin because its total circulating supply exceeds 148.96 billion DOGE and the token has no maximum supply limit. Trading activity has risen because traders have reacted to new bullish technical indicators in the market.
Technical Indicators Show Bullish Trend
Multiple technical indicators suggest Dogecoin demonstrates increasing bullish power in the market. The current value of the Relative Strength Index points to 55.11. The present readings indicate rising demand for purchases, yet the metric stands below the mark that defines overbought status at 70. If the market stays positive, then growing RSI readings will forecast extended upward price movement.
Dogecoin is currently priced at $0.1719, showing a strong 8.60% increase in the past 24 hours. The market cap stands at $25.61 billion, with a significant 17.66% rise in 24-hour trading volume, totaling $1.26 billion. The chart shows a steady upward trend throughout the day, starting from around $0.1584 and peaking above $0.171. With a circulating supply of 148.96 billion DOGE and no max supply cap, investor interest appears strong, likely driven by recent market momentum.
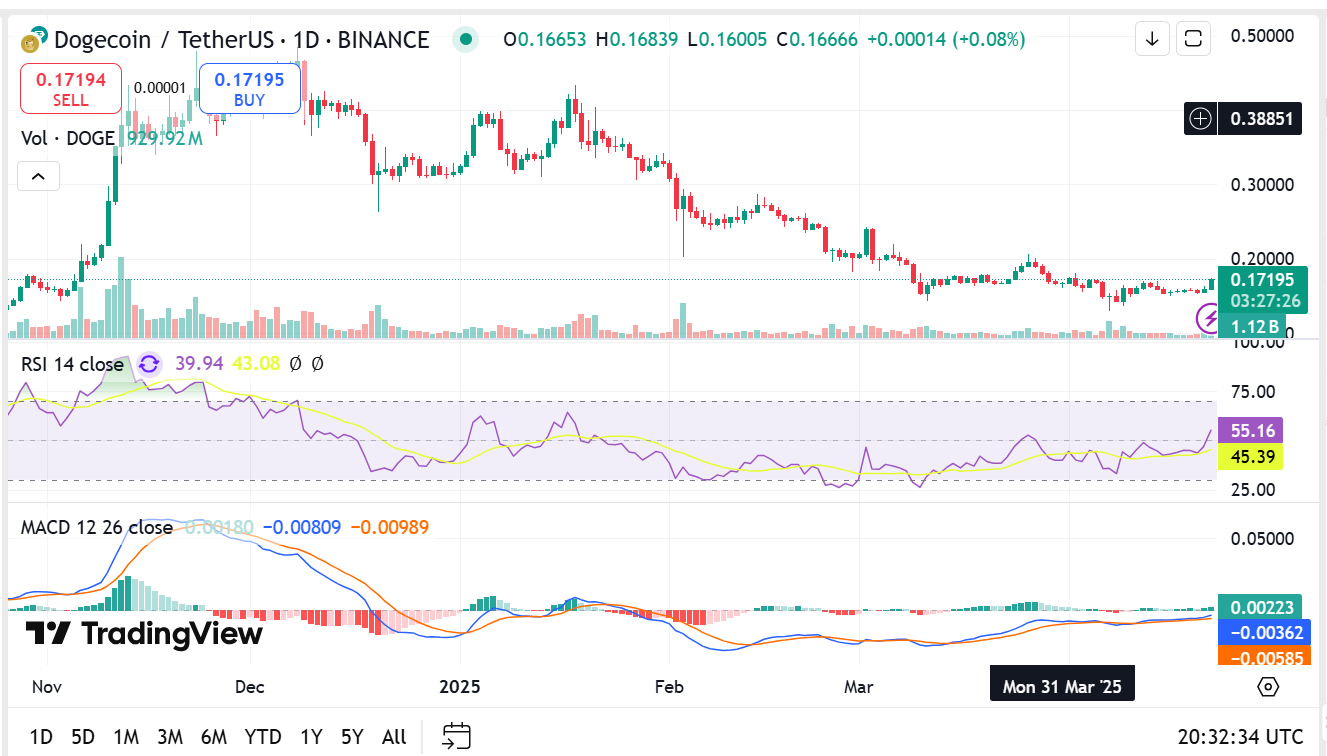
Source: Tradingview
The Moving Average Convergence Divergence (MACD) will shortly perform a bullish crossover signal. The MACD line rests at 0.00222 above the signal line at -0.00362. Such crossovers between the two moving average lines become significant indicators when prices demonstrate momentum strength, suggesting an impending trend change. The price indicators alongside volume data indicate Dogecoin is starting its recovery phase after spending time in a consolidation phase.
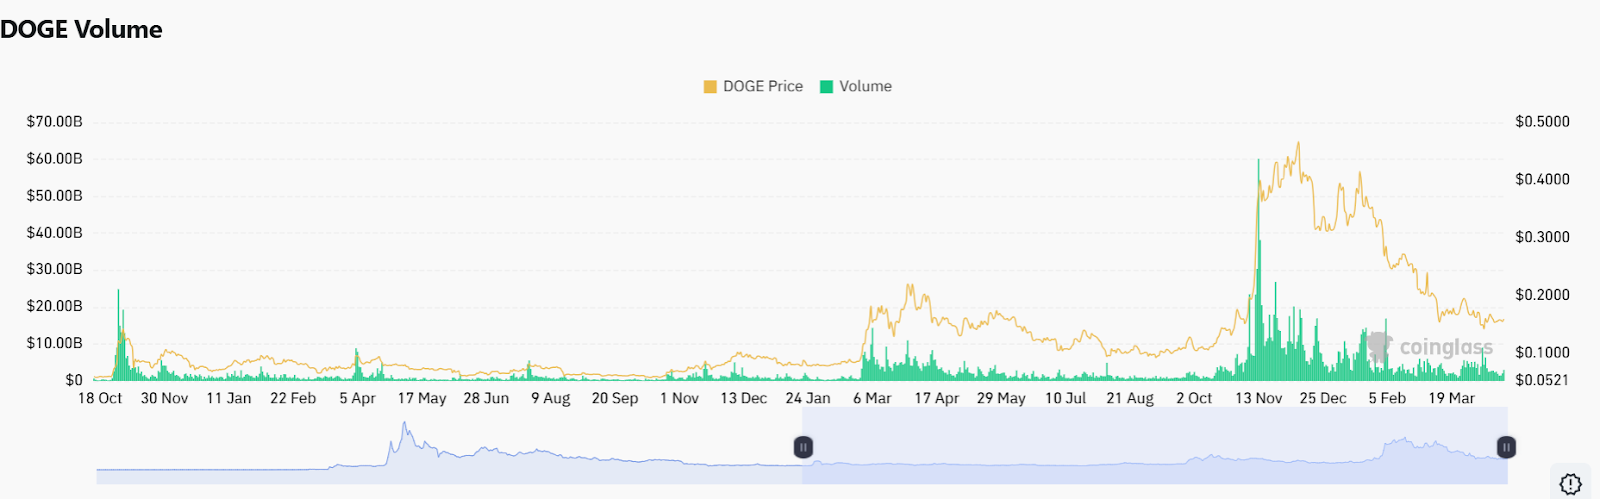
Source: Coinglass
The enhanced daily trading volume is additional evidence that backs up price movements. The overall trading activity across a 24 hour period grew by 17.66% until it reached $1.26 billion. The strength of market participation increases when trading volume grows during price uptrend


