
- ETH maintains position above the vital $1,580 support point which indicates investors seek to purchase at lower values.
- The bullish trend indicators provide early signs for upward movement yet they do not provide enough evidence to validate a market pivot.
- Previous MVRV Price Band breakouts caused big market rallies, which suggests investors would find this area appealing for trading opportunities.
ETH recorded a modest daily increase of +1.16% to reach $1,606.8 during its latest market conduct following extensive market slumps. The brief push up towards $1,580 recovery support creates market optimism mainly because important performance metrics hint at upcoming bottoming behavior. Analysts closely observe the $1,606–$1,650 range because historical buying triggers now combine with developing bullish momentum that includes MVRV Price Band dips and momentum oscillator reversals.
Ethereum (ETH) is showing signs of a tentative rebound after a sustained downtrend, closing at $1,606.8 in the latest daily session with a modest gain of +$18.4 or +1.16%.The market data suggests that Sellers might have established a potential floor around $1,580 especially after ETH dropped significantly from its peak of $4,000 this year. ETH demonstrates short-term bullishness yet this trend cannot eliminate the bearish outlook because sellers control lower-high precision points after failed attempts at momentum sustainability.
Can RSI and MACD Fuel a Breakout?
The Relative Strength Index (RSI) maintains a position of 41.57 at present which shows slight improvement from its oversold state while continuing under the 50 neutral value level. While selling pressure has slowed down recently the buying momentum still fails to show signs for a market reversal. A rising trend is unlikely because the RSI’s moving average (yellow line) nears 36.64 without creating a solid uptrending momentum. Crypto market participants demonstrate similar hesitation because macroeconomic uncertainties combine with regulatory challenges that lead to market uncertainty.
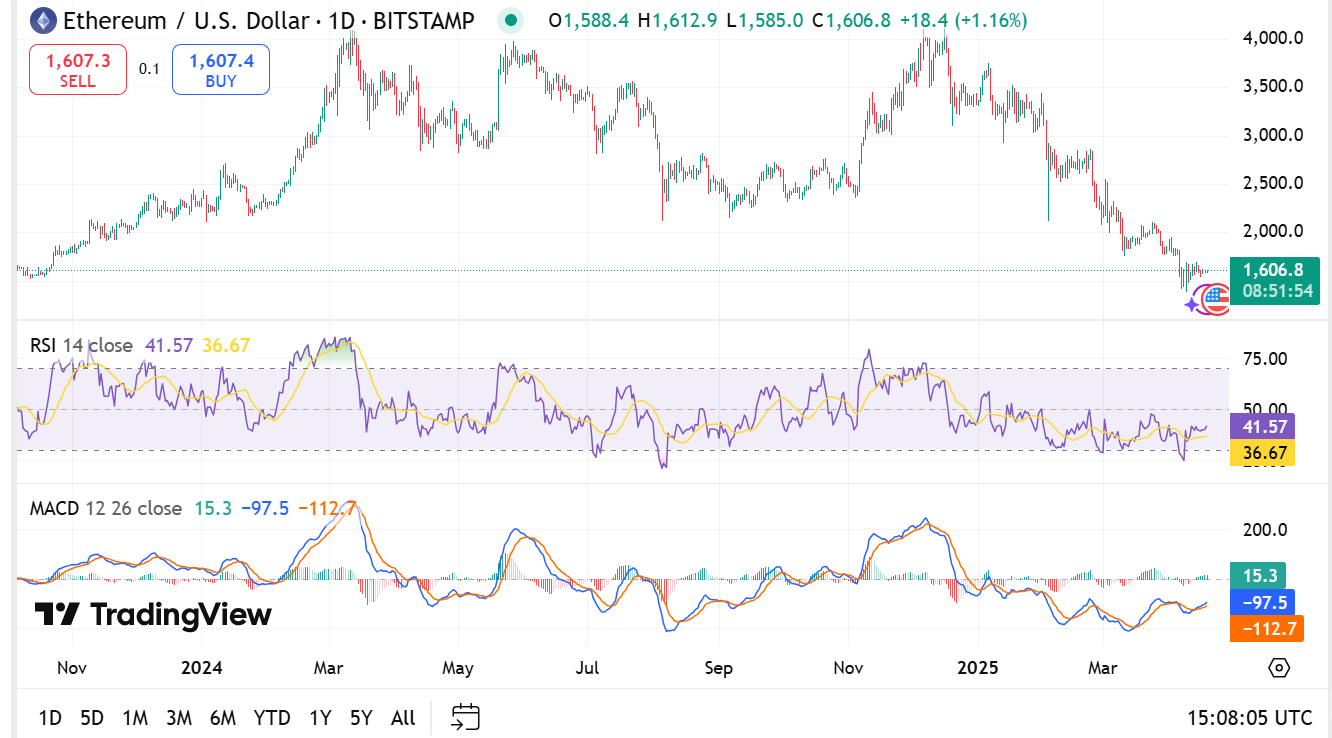
Source : Tradingview
The Moving Average Convergence Divergence (MACD) also paints a cautious picture. Early bullish signs appear from the positive MACD position at 15.7 yet the negative signal line stands at -97.9 while the histogram shows -112.7 in the negative range. The market requires additional evidence to validate that Ethereum has established a base as the current signs only hint at possible base formation. The fundamental analysis requires traders to observe the price movements between $1,600 and $1,650 because these levels can indicate buying signals and possible market entries.
MVRV Signal Flashes Green for ETH Bulls
Crypto analyst @ali_charts posted through Twitter about a favorable investment point for Ethereum ($ETH) where the MVRV Price Band reaches its lowest threshold which historically drives intense purchase activity. Multiple downward price movements of Ethereum can be observed in the Glassnode chart through arrows which demonstrate the currency entering the 0.8x MVRV band followed by substantial price increases.
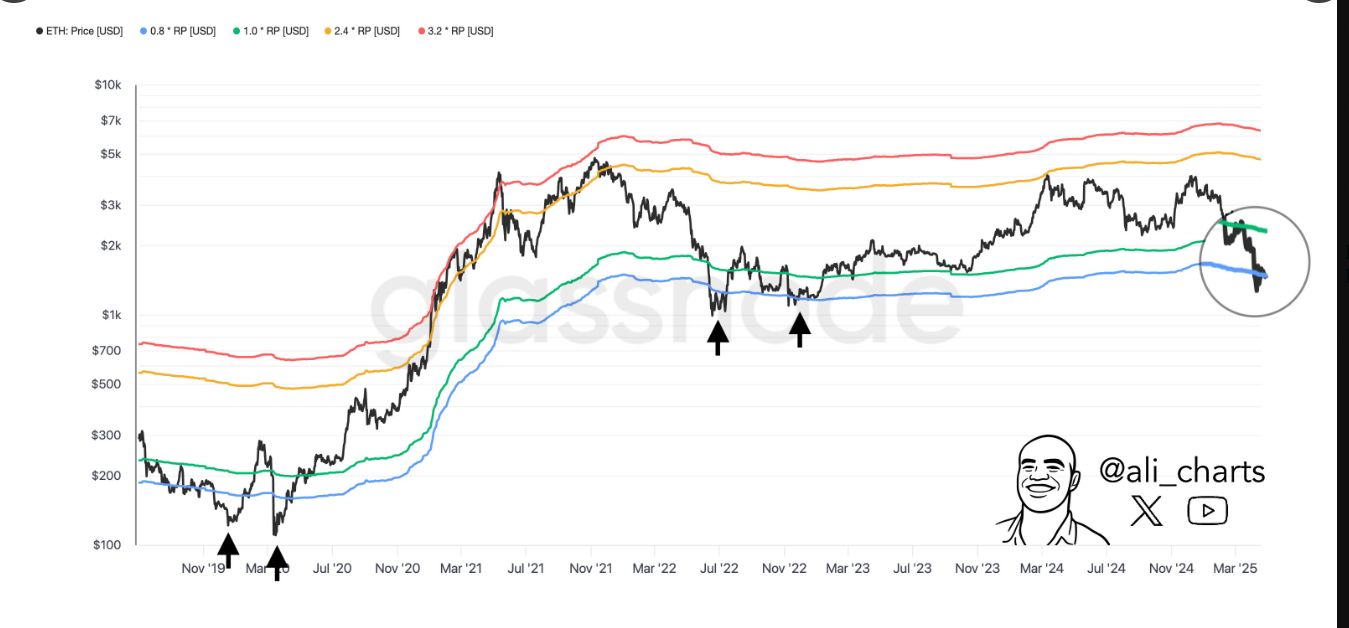
Source : X
The lower MVRV band visit of Ethereum has prompted the tweet author to assert attractive investment risks along with potential rewards available for investors entering this point.
Technological evaluation of the ETH/USD price chart reveals Ethereum could navigate a substantial price ascent after market accumulation periods and subsequent phases of new value accumulation. A potential market bottom develops in the current re-accumulation phase according to the chart data while stochastic oscillator levels reached their lowest point historically before price increases occurred.
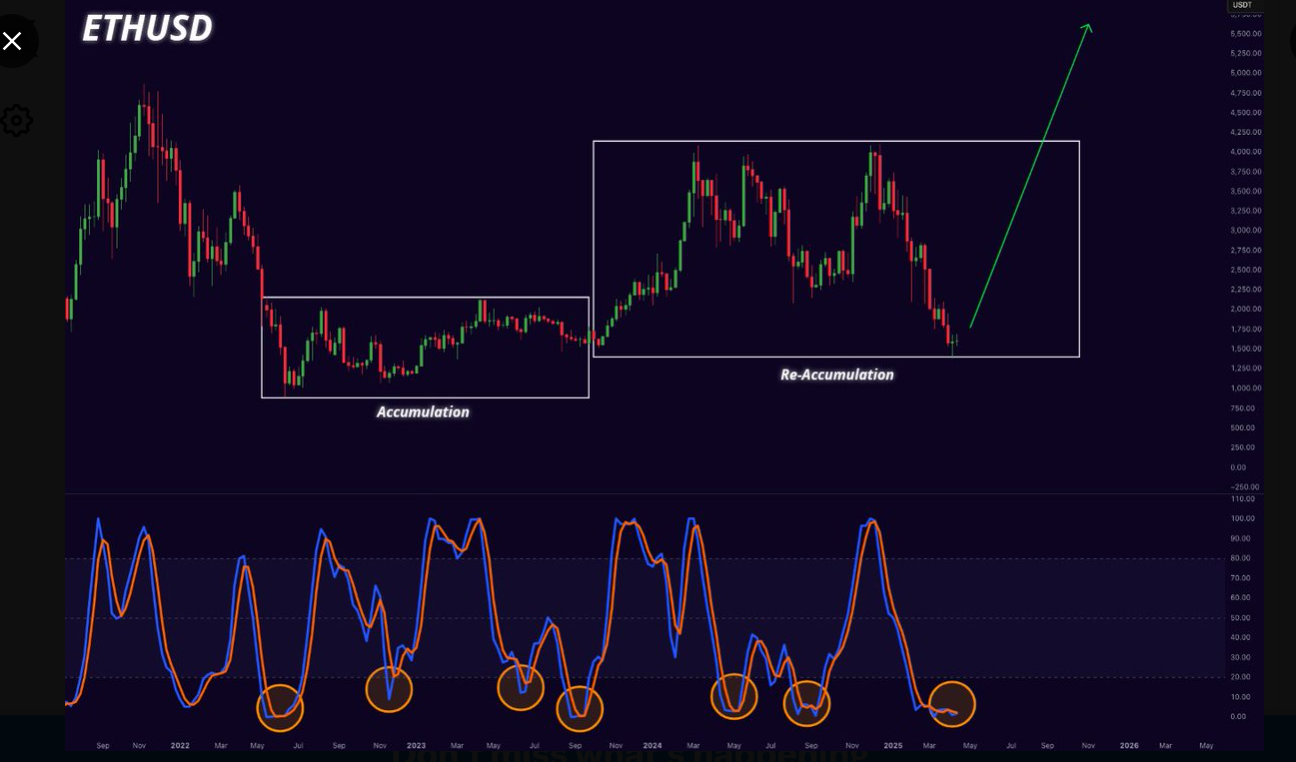
Source : X
The repeated price reversals throughout the history of the market make the current indicator crossover point at oversold zones increasingly bullish until multiple previous reversals. A green indicator on the price chart suggests an upcoming swift price increase which could reach and exceed $5,000 according to historical data.


