
- Ethereum recently formed a golden cross pattern and touched $1,800 before retracing slightly.
- The active addresses of Ethereum increased by nearly 10% over 48 hours as the need for the network continued to grow.
- Derivatives turnover reached $78 billion as traders sought to continue rallying higher.
Ethereum has triggered a rare golden cross on the daily chart, according to a chart shared by Merlijn The Trader. The bullish crossover in which EMA short-term crosses over the long-term EMA points to an upward movement in the ETH price. The price rose and touched the $1,800 line of resistance before moving downwards slightly.
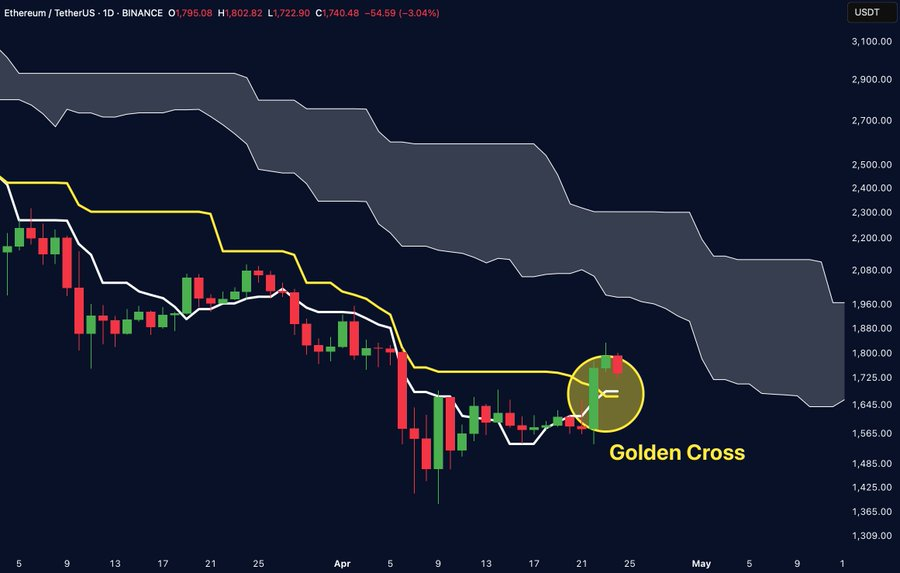
This formed a golden cross as ETH rose from weekly support at $1,650 to a new high of $1,818 in the week. Although the price fell to $1,740, the setup suggests accumulation, particularly with better macro factors and institutions flowing into various cryptos.
Network Activity Shows Clear Upside Momentum
Ethereum activity, as stated by CryptoQuant’s Carmelo Alemán, rose 9.85% from April 20 to April 22 in terms of active addresses. The number of unique addresses increased from 306,211 to 336,336, which is evidence of growth in demand for the network. He believes this will increase ETH’s usage, with developers putting more applications on the Ethereum base layer.

The sharp uptick in the on-chain activity points to a general rise in overall cryptocurrency market trends, including an increase in trade conditions and risk-taking abilities. Due to Donald Trump temporarily halting more tariffs with China, the market mood was risk-on and boosted Ethereum’s recent rally.
However, there is an upward trend in Ethereum’s performance, which is still lagging behind Solana on a weekly basis. Solana has risen by 20% in the past seven days, which trails only Ethereum’s 15% rise. This can imply that some investors are adopting Layer 1 solutions with higher throughput and cheaper fees.
Derivatives Market Signals Bullish Leverage
Ethereum’s derivatives trading volume rose by 29% in daily trade to $78.06 billion, as seen by data available from Coinglass. Open interest also rose to 2.72%, while option’s volume surged over 20%. The funding rate of ETH/USDT on Binance is 1.0255, which indicates that longs are slightly more popular, but Binance accounts and positions show much higher long-only rates of 2.3772 and 2.1211, respectively.
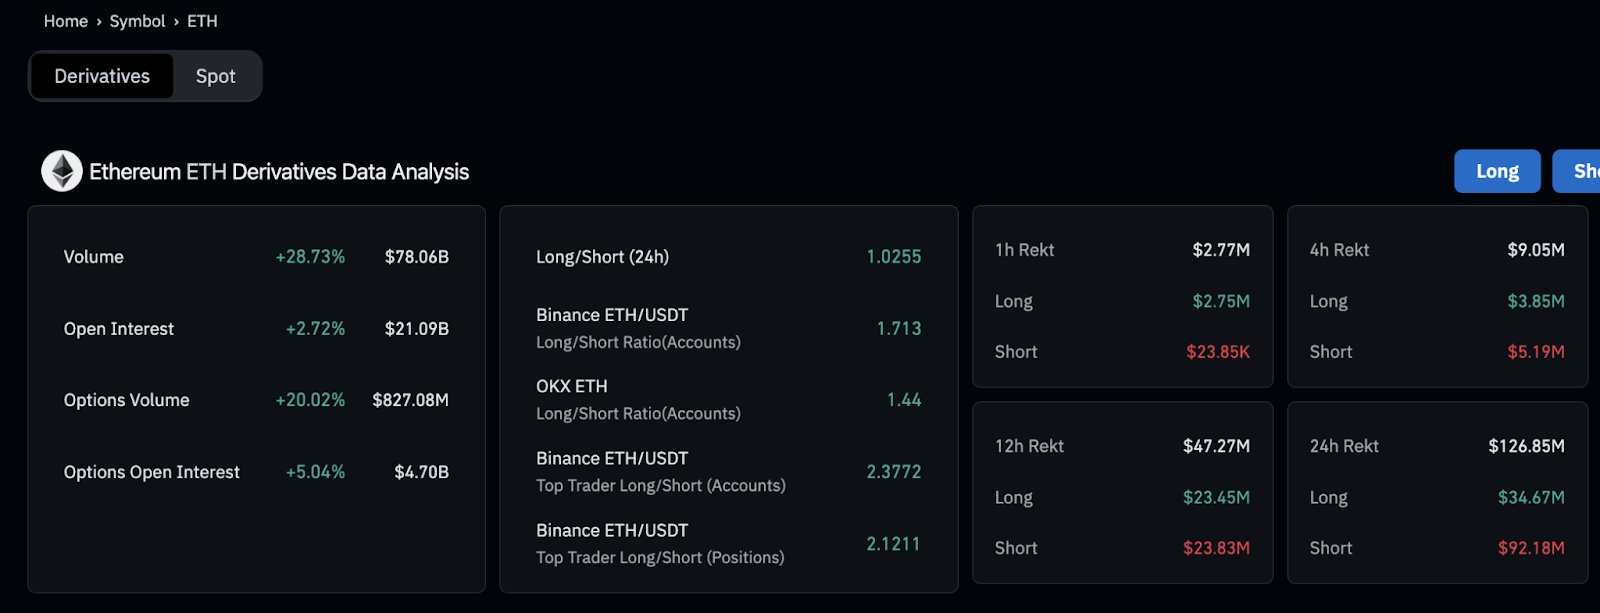
These figures suggest that there is increasing speculative interest in anticipation of higher price movement. Furthermore, $92.18m in short liquidations were seen in 24 hours, indicating short sellers anticipating the decline and a wave of margin calls during the rebound.
However, while whales are increasing their stash, volatility is still high. ETH’s price could not sustain above $1,800, failing to which the current consolidation around $1,740 suggests that the price may retrace lower in the short term. If support is sustained above $1,750, attempts would be made to break through the price back to the monthly high of the up-months.
Ethereum short-term bulls rely on defining an upright pattern beyond $1,800. The golden cross increased address activity, and bullish derivatives should support the continued advancement. However, the broader set of questions is whether Ethereum will remain the dominant player in the smart contract space or not as competition starts to emerge.


