
- Ethereum is consolidating within a wedge pattern, signaling a potential breakout toward $2,500–$3,000.
- RSI at 55.33 and a bullish MACD crossover confirm growing buyer strength and upward momentum.
- 24-hour volume jumped 9.90%, with a perfect 100% profile score, reflecting strong fundamentals and investor confidence.
Ethereum (ETH) is heating up the crypto market once again, with strong technical signals and rising momentum pointing toward a major move. As trading volumes surge and price action tightens, all eyes are on ETH for what could be a breakout that reshapes the short-term outlook. Here’s everything you need to know about Ethereum’s latest price action, expert predictions, and technical analysis.
‘According to Mister Crypto, Ethereum (ETH) is on the verge of a major breakout as the latest technical chart shows a classic consolidation pattern forming within a descending wedge. After months of persistent decline from early 2025 highs, ETH has been squeezing between a strong descending resistance and rising support, with price action now approaching the apex.
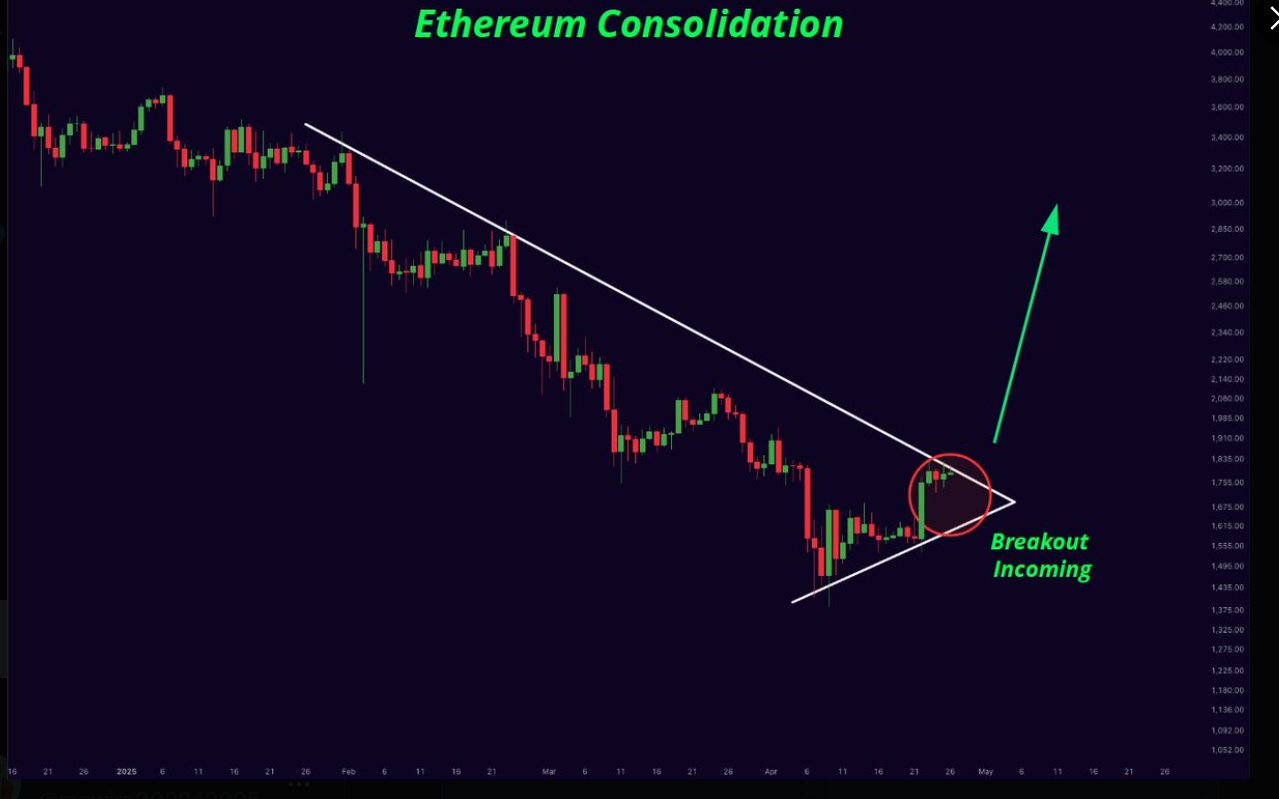
Source: X
As per Mister Crypto’s analysis, a breakout is incoming, and if ETH manages to push past the upper trendline, it could trigger a bullish rally toward the $2,500–$3,000 range. With selling pressure weakening and momentum building, Ethereum traders are closely watching for a decisive move in the coming days.
Current Ethereum Price
Ethereum (ETH) is trading at $1,794.9 , showing a modest 1.04% increase over the past 24 hours. The market cap stands at $216.51 billion, reflecting a slight 1.04% uptick, while the 24-hour trading volume surged significantly by 9.90% to $16.35 billion. The total and circulating supply both hold steady at 120.72 million ETH, with no maximum supply limit set.The Volume/Market Cap ratio is at 7.72%, suggesting healthy trading activity relative to its size.
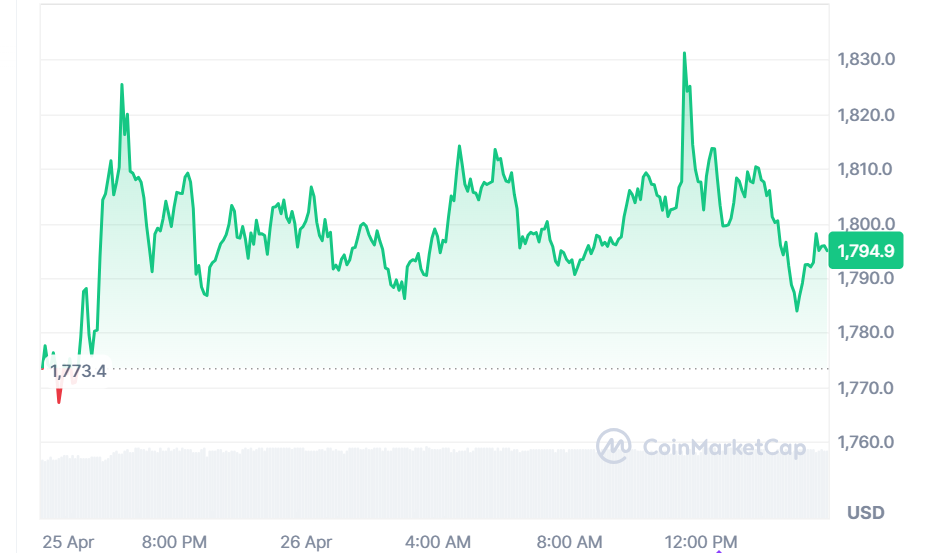
Source: CoinMarketCap
Technical Indicators Flash Green as Buyers Take Control
Trading View shows Ethereum (ETH) performs with bullish indicators at $1,794.9 with an increase of 1.04% daily and reached its highest point at $1,831.2. The Relative Strength Index (RSI) level is set at 55.33 indicating moderate market strength while allowing more upside potential until reaching overbought conditions. The MACD indicator reveals a bullish crossover at this time because the MACD line is currently positioned at 41.2 while the signal line sits at -16.5 above it. The recent price movements along with technical indicators show that new purchasing interest is increasing so Ethereum could maintain upward momentum.
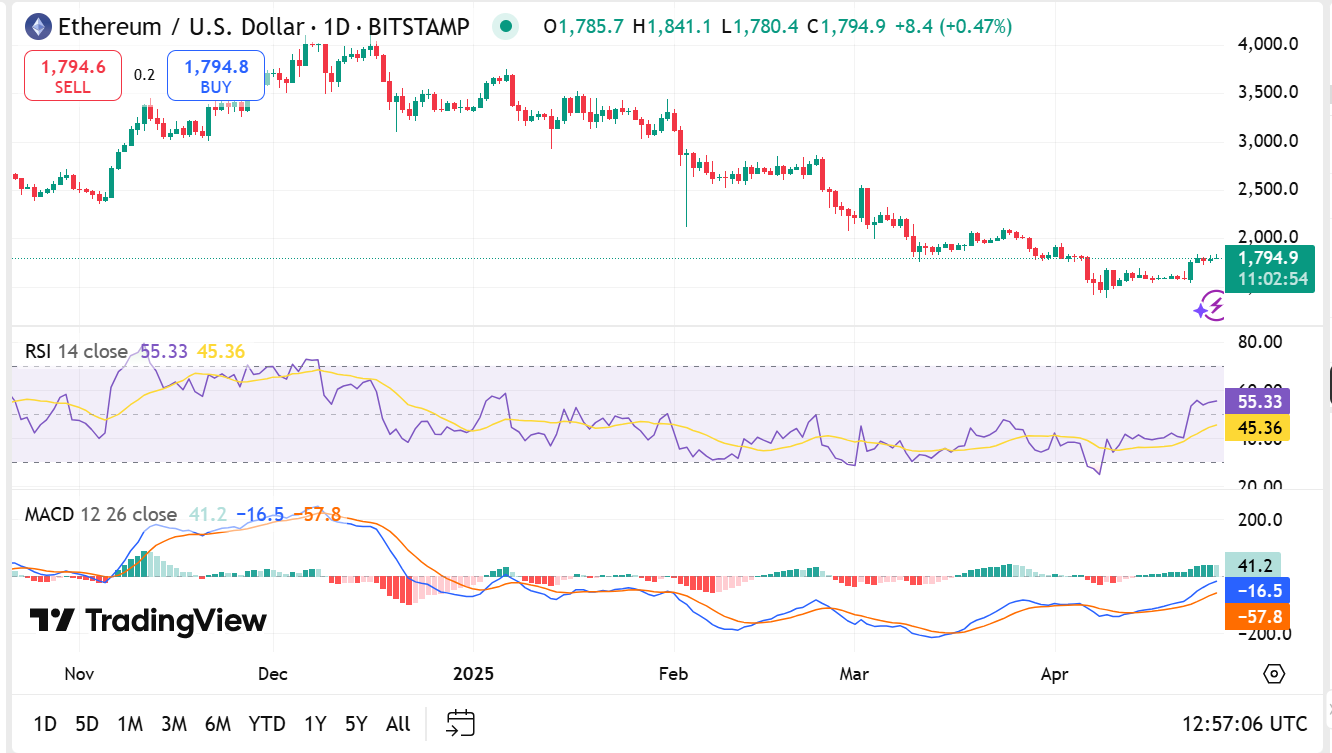
Source: TradingView


