
- Ethereum remains range-bound, trading near key support at $1,765 with limited short-term volatility.
- RSI and MACD suggest neutral momentum, with no strong bullish or bearish signals confirmed yet.
- Price action near the $1,779–$1,818 EMA cluster may trigger a major breakout or breakdown.
The Ethereum cryptocurrency remains stable at $1,765.30 at a critical level that continuously drives price swings during its nine-year market existence. Ethereum maintains a price position that acts as a stabilizing factor when market prices fall. Ethereum has demonstrated a stable value increase since 2016 while maintaining movements between multiple price bands, which might determine its market trajectory ahead.
During bullish movements, the price was resisted at the upper level, while there’s been support at the lower level price. From late 2021 into early 2022,
Bitcoin and Ethereum fell below their upper margin, forming support in the middle section of the Bollinger Band. Price levels began to stabilize in the intermediate price zone at the beginning of May 2025.
Price Indicators Present a Phase of Indecision Throughout Major Metric Ranges
Short-term movement occurs in the small price range. Ethereum has been in a trading range of $1,867 in the 4 hours. Market volatility has cooled down in the Keltner Channel around this price area. It shows buying & selling strength at the same time with the price staying pretty close to the central line of the Keltner channel.
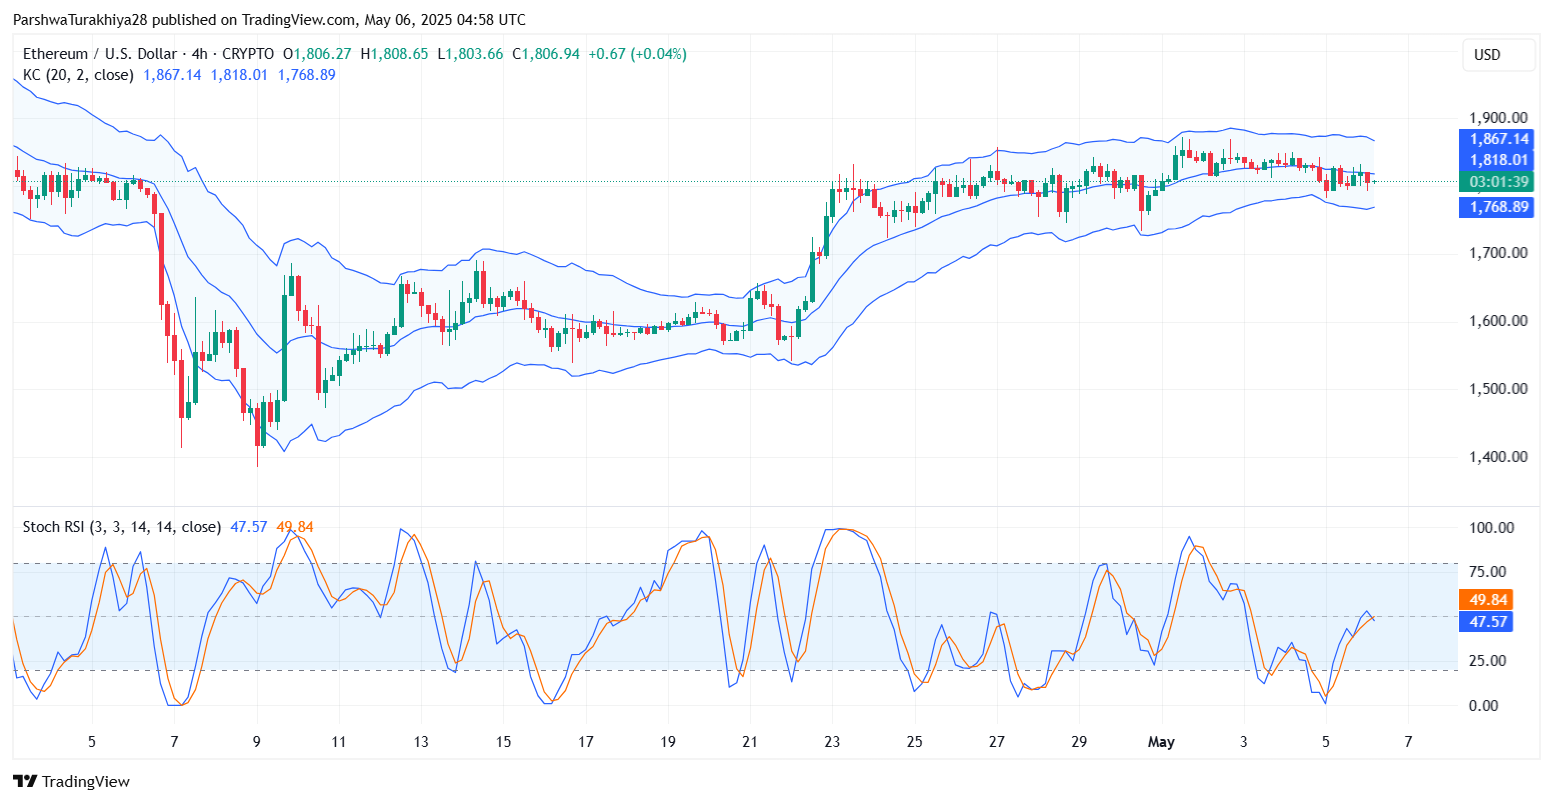
The indicators form a cluster in the same middle zone. The current reading
the relative strength index stands at 45.88, below the midpoint area. The market shows mixed emotions based on RSI statistics that remain below the fifty mark. The indicator is positioned below its basic axis point. Although selling pressure appears to decline, the indicator maintains a stable position without forming a bullish sign. The market pressure suggests it needs a major catalyst to verify its future direction.
In addition, the MACD indicator sits beneath its zero-axis point. The indicator shows signs of slowing down selling pressure, yet it has not established a bullish reversal pattern. The market pressure suggests it needs a major catalyst to verify its future direction.
EMA Cluster Builds Dense Barrier Between $1,779 and $1,818
Ethereum’s future price movements depend on market responses at the crucial support resistance area between $1,779 and $1,818. Technical traders find the greatest potential in this price level, where various essential exponential moving averages converge at 20, 50, 100, and 200 EMA clusters. Traveling within this price area for too long will likely result in an underlying market shift.
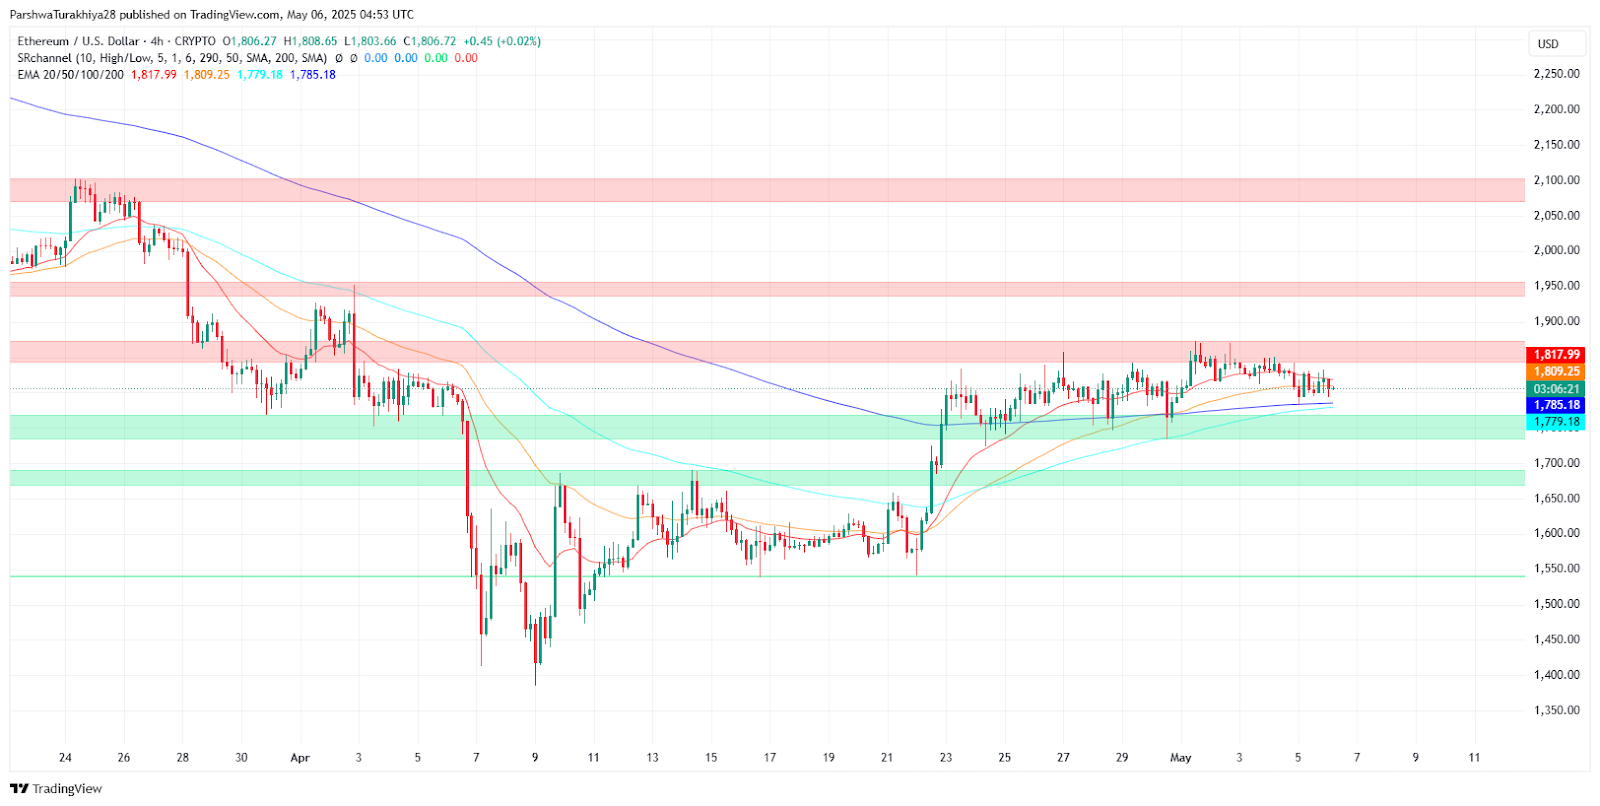
However, moving through this price band for an extended period might trigger a fundamental market movement. A definitive breakdown from $1,775 would likely drive the price downward toward $1,720–$1,740. If that level, on the other hand, fails to hold, then a deeper support near $1,680 is expected to come into play, where buyers were previously interested.
The ascending trend could gain momentum if bulls take control to reclaim the support level at $1,846. Pseudo-resistant point formation for upward engagements would occur if Ethereum reclaimed space above the triangle base. The market continues to be cautious while remaining within its established range.
Price Movement Remains Bound to Historical Structure
Furthermore, Ethereum’s overall structural framework continues to govern its current market response. Ethereum’s price has followed a consistent curved pattern since its initial years of existence.
Since Ethereum launched its first version, the price has shown standard behavioral patterns where main zones provide support alongside resistance areas to limit price fluctuations.


