
- ETH/BTC holds key support at 0.0185 BTC after early April recovery.
- RSI and MACD indicators show neutral-to-bullish signals.
- A break above $1,845 may push ETH toward $2,033 and higher targets.
The trading value of Ethereum paired against Bitcoin exists in a key support range at 0.0185 BTC. The ETH/BTC pairing fell below 0.0180 BTC in early April before a sudden upward movement cut through a descending channel.
The ETH/BTC pairing dropped under 0.0180 BTC in early April. Still, it quickly pushed upward through a descending channel. Ethereum maintains a static price, holding within a limited zone above its support level after its successful breakout phase.
However, ETH’s current support position would increase selling pressure. The area above present trading levels features open space in the liquidity zone, serving as a potential objective for optimistic market movements.
In addition, the section holds pending purchase orders whose execution depends on returning trading volumes. RSI and MACD technical indicators show neutral to slightly favorable signals for the current market condition. Respecting RSI 54.51, the index stays positive after exiting oversold territory.
The MACD index now exists above its signal line while green histograms continue to increase. The momentum signals favor rising prices, but technical confirmation is still needed for verification. The market strength that follows the $1,845 resistance could push the market to approach the $2,000 price point.
Fibonacci Levels Outline Potential Resistance Points
A current Fibonacci study indicates that $2,033 represents the nearest anticipated increase target due to its 1.618 extension analysis. The 2.618 extension marks $2,338 resistance alongside the 3.618 extension corresponding to the $2,643 resistance level.
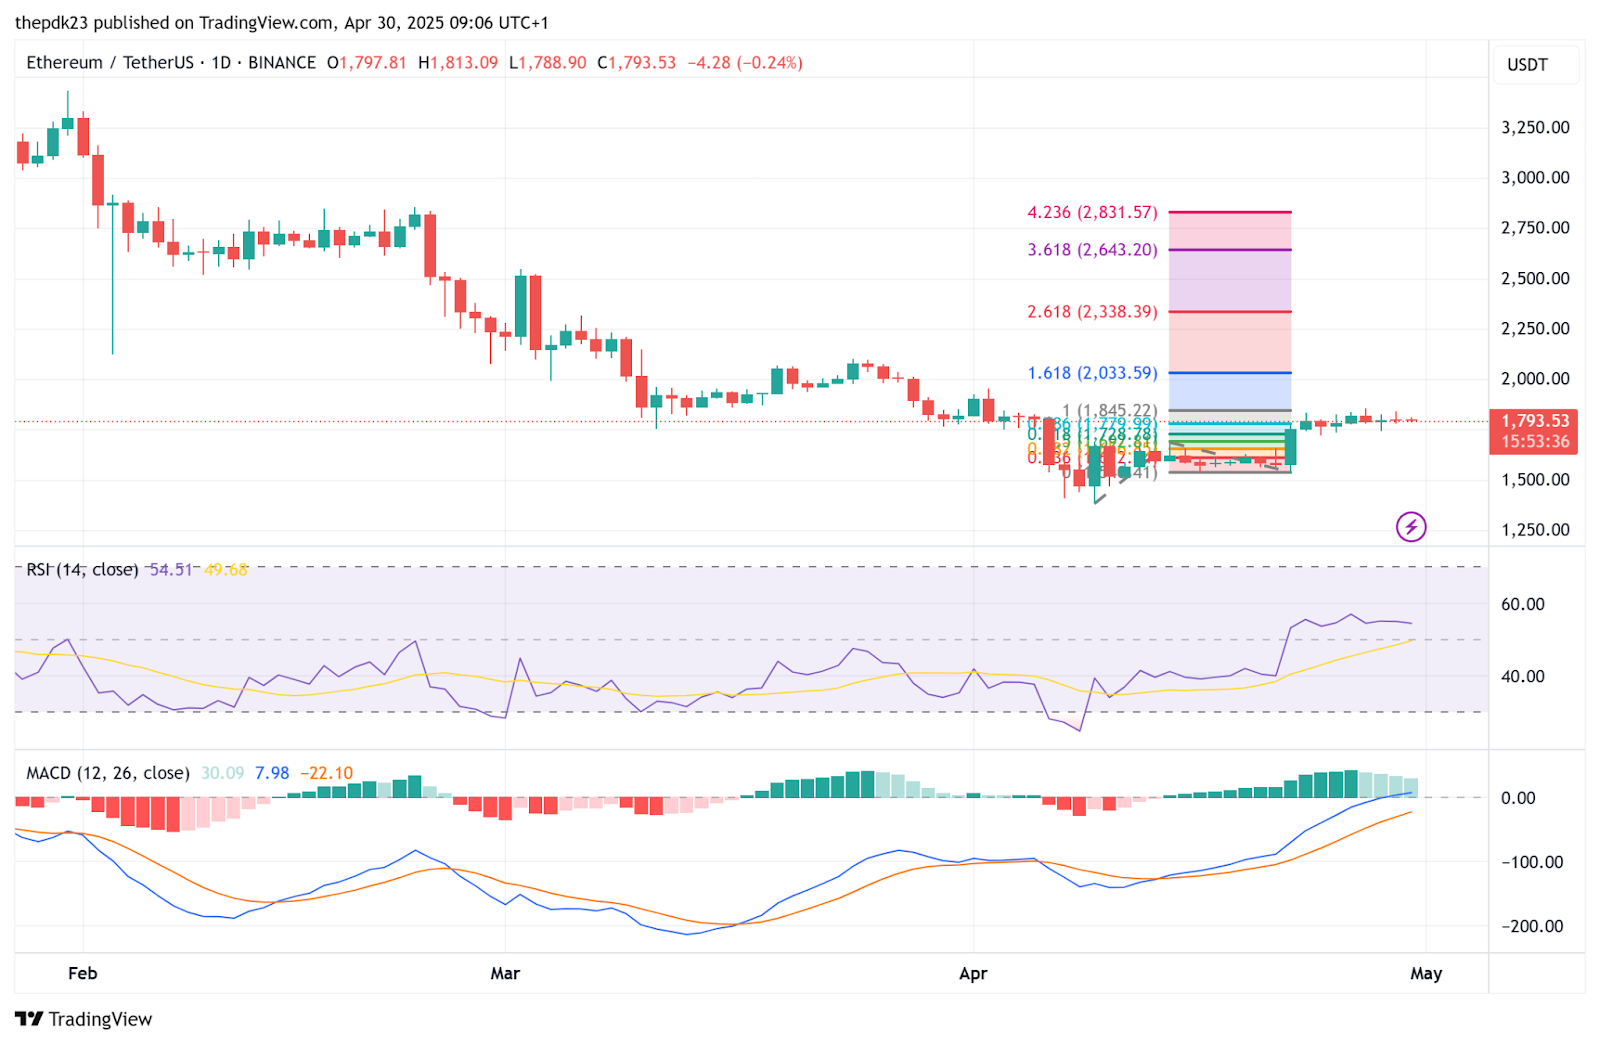
The 4.236 extent creates a potential point at $2,831. These Fibonacci levels serve as short-term price targets when Ethereum surpasses its current resistance barriers. The market observes these support thresholds because the price momentum is intensifying near the $1,790 area.
Ethereum’s price history shows major long-term market swings
The Ethereum market started trading at $1.83 in March 2016 and reached $14.48 by June 2016 while crossing the $1 billion market capitalization threshold. The market value dropped to $11.33 after a 45% price decrease following the DAO hack.
Furthermore, the March 2017 records demonstrate Ethereum achieved its maximum value of $401.49 after starting at $46.35 while reaching its apex in the ICO boom period. The July price reached $157.36, while September recovered to $253. The Ethereum network reached $1,000 in value in January 2018 yet finished the year at only $91.01. The prices for ETH moved between $130 and $735 throughout 2020.
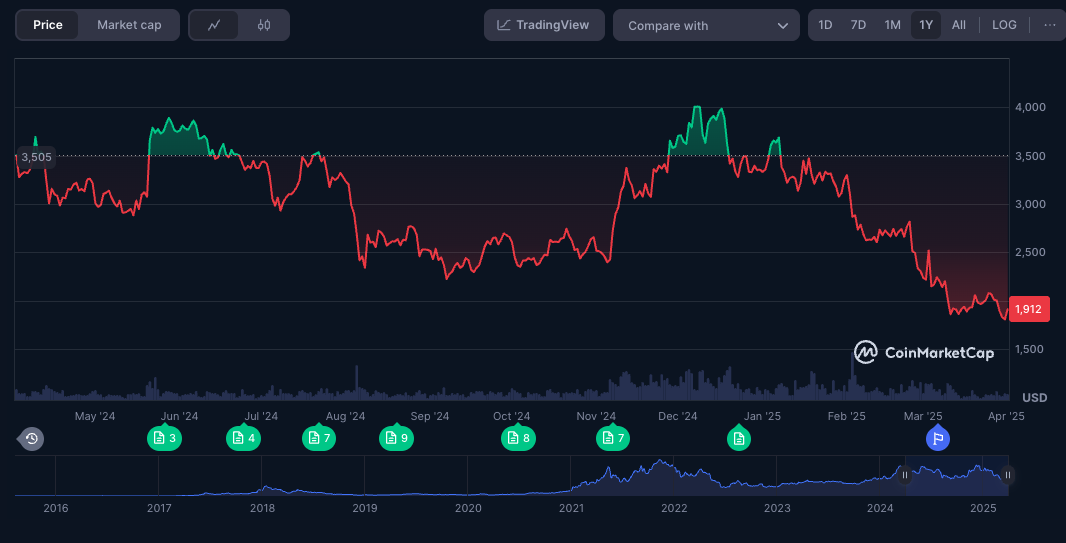
The price of ETH reached its maximum point at $4,293 in May 2021 before closing the year at $3,679. The cryptocurrency market experienced a downtrend in December 2022, but Ethereum hit its minimum point of $1,196. In March 2023, the Ethereum token achieved its highest value of $3,595, yet it declined to $2,458 throughout the same year.
In addition, throughout December 2022, the coin exchanged hands within the range of $3,504 to $3,670. The Ethereum token exchanged $3,350 and $3,624 in January 2025 to conclude at $3,282. The February trading activities recorded Ethereum at $2,796. experienced a price reduction to $1,827 during the later part of March. The ETH trading price reached approximately $1,917 early in April 2023 while continuing to grow yearly.


