
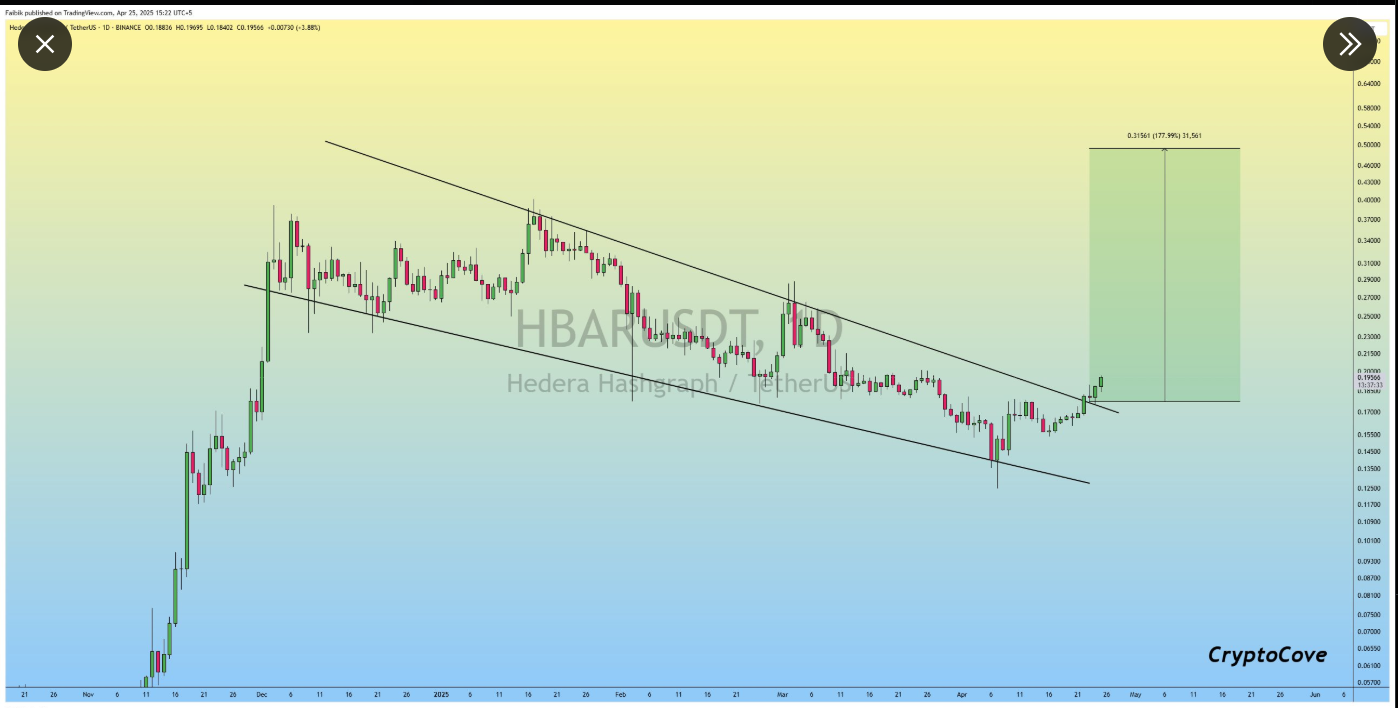
- Hedera has exited a multi-month descending channel, a classic bullish reversal pattern, with analysts eyeing a potential target near $0.50, a 177.99% upside.
- A 44.57% spike in 24-hour trading volume and an 4.01% increase in market cap to $9.95B reflect rising investor interest and buying pressure.
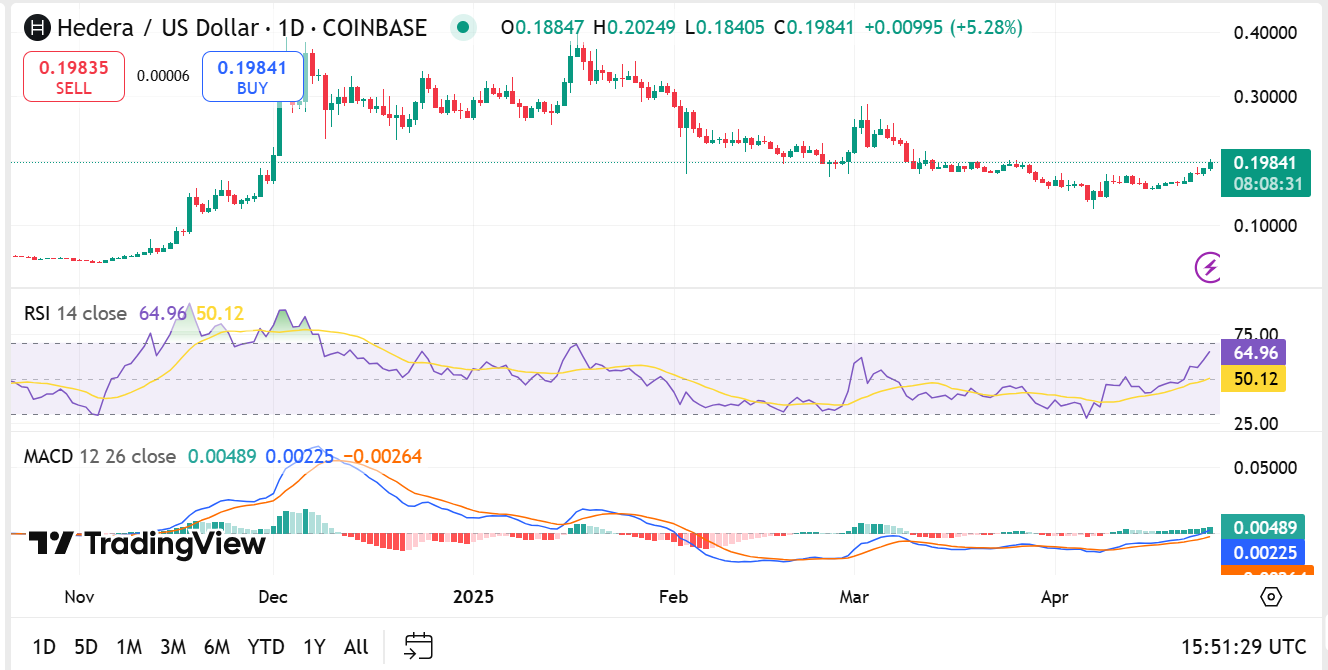
- RSI nearing 70 and a fresh MACD bullish crossover suggest continued upward momentum, with HBAR currently at $0.19841, up 5.28%.
Hedera (HBAR) shows exceptional potential for market growth based on three powerful synergies between technical breakout patterns and ascending volume statistics, and positive momentum readings. The technical outlook points toward a bullish momentum for HBAR based on predictions by Captain Faibik and the positive movement of various metric indicators, which could create a significant market rise.
According to Captain Faibik’s latest analysis, Hedera (HBAR) has officially broken out of a long-standing descending channel on the daily chart, signaling a potential bullish reversal. The price movement now seeks a 177.99% jump towards $0.50 following the breakout above this upward trendline. The price pattern, together with ongoing upward movement and growing volume indications, shows that investor confidence keeps rising and supports the possibility of sizeable market gains under suitable market conditions.
Source: X
Current Hedera (HBAR) Price
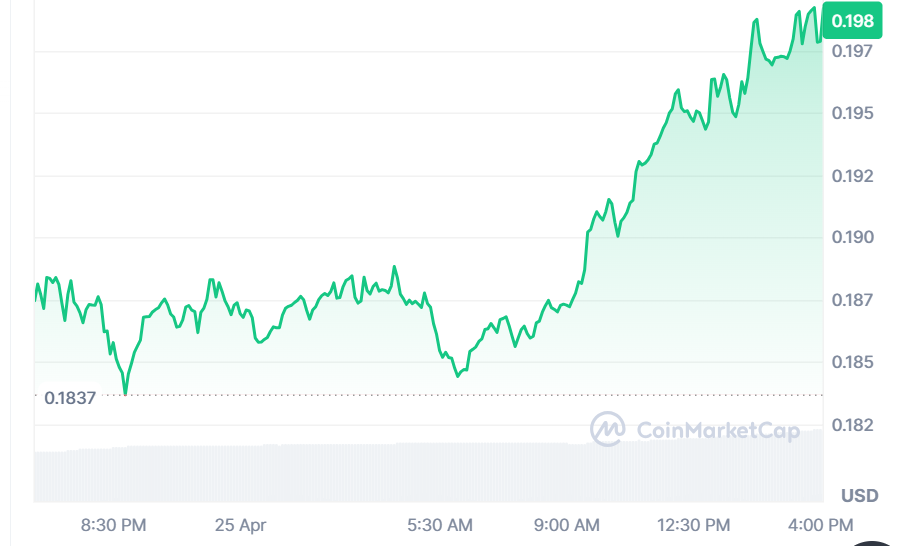
In the past 24 hours, Hedera (HBAR) has experienced a significant price surge of 5.28%, climbing to $0.19841. This upward movement is accompanied by a notable increase in trading volume, which soared by 44.57% to reach $338.3 million. A 4.01% boost in market capitalization made it reach $9.95 billion while investor engagement increased. The live HBAR tokens that exist in circulation amount to 42.22 billion tokens, while the maximum possible distribution counts 50 billion tokens in total. Price evidence during the day points to increased market momentum as the price rose consistently from $0.1837 throughout the day until it approached $0.200 before facing some short-lived price reduction.
Source: CoinMarketCap
Momentum Indicators Flash Green as Rally Potential Builds
Hedera (HBAR) is showing strong bullish momentum on the daily chart, closing at $0.1981 with a 5.28% gain, signaling renewed investor confidence. RSI has achieved an index value of 64.96, which draws the indicator toward the overbought zone at 70, signifying increasing market buying power. The MACD has performed a bullish crossover because its line now sits at 0.00489 above the signal line located at 0.00264, which typically indicates more run-ups will occur. Latest price actions have penetrated previous trading zones while technical indicators project positive movement, provided momentum levels stay strong.
Source: TradingView


