
- Solana shows a 1.5% price dip but is near a key support level.
- RSI at 52.99 indicates balanced market sentiment, with room for upside.
- MACD’s bullish crossover suggests the potential for an upward trend continuation.
As of April 14, Solana’s (SOL) price action shows a 1.5% dip, yet several indicators suggest potential for a reversal. The chart shows a clear uptrend channel, suggesting that Solana’s price is poised for a rebound, especially if the support at $94.55 holds.
Are Solana Bulls Preparing for a Rally?
Looking at the RSI, which currently stands at 52.99, the token is nearing the neutral zone. This indicates that the market sentiment for SOL is balanced, with neither bulls nor bears having a strong control. The RSI value suggests the token has room to push higher if buying pressure continues. A sustained RSI level above 50 could signal continued upward momentum.
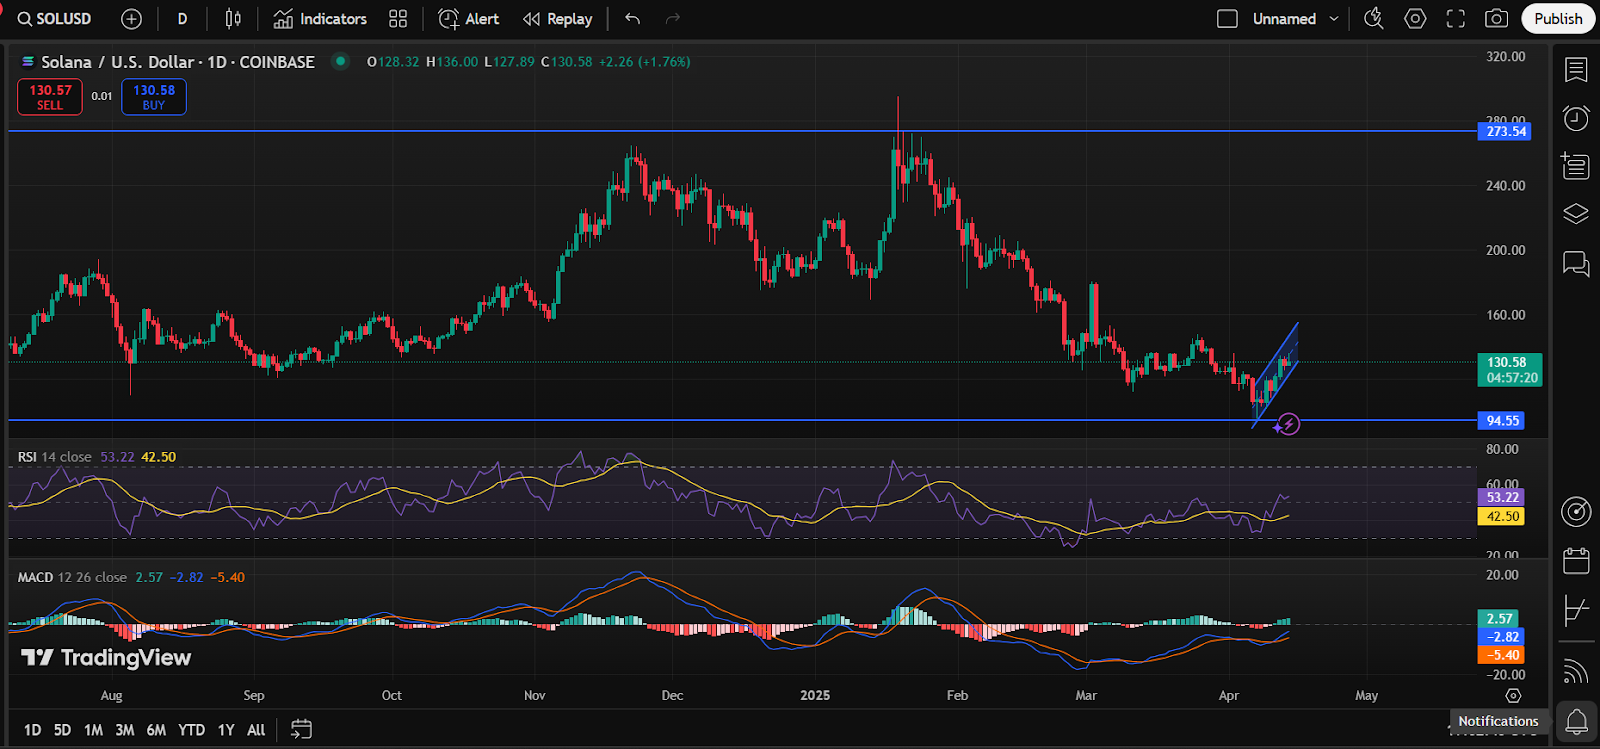
Additionally, the MACD (Moving Average Convergence Divergence) indicator is showing a positive shift. The MACD line at 2.55 is currently above the signal line, which is at -2.86, implying a bullish crossover. This suggests a possible upward trend in the near term, as the MACD histogram is showing positive momentum, supporting the idea of a potential reversal from its 1.5% dip. The histogram bars are increasing in size, suggesting the strengthening of bullish momentum.
The price of Solana currently challenges its main support point at $94.55. A successful price bounce from this level will meet resistance at $127.89 before reaching its upper target at $273.54 which faced resistance previously. The present technical indicators suggest that Solana may reverse its recent price decline by starting an upward surge if its upward momentum continues.
Solana’s Current Market Performance Revealed
Analyzing the current market situation, one can notice that today Solana has the value of $129.52 and decreased by 1.06% within the past day. The market cap it holds amounts to 66.84 billion dollars while the turnover of the market is 4.9 billion dollars which is 34.49 % up from the previous day.
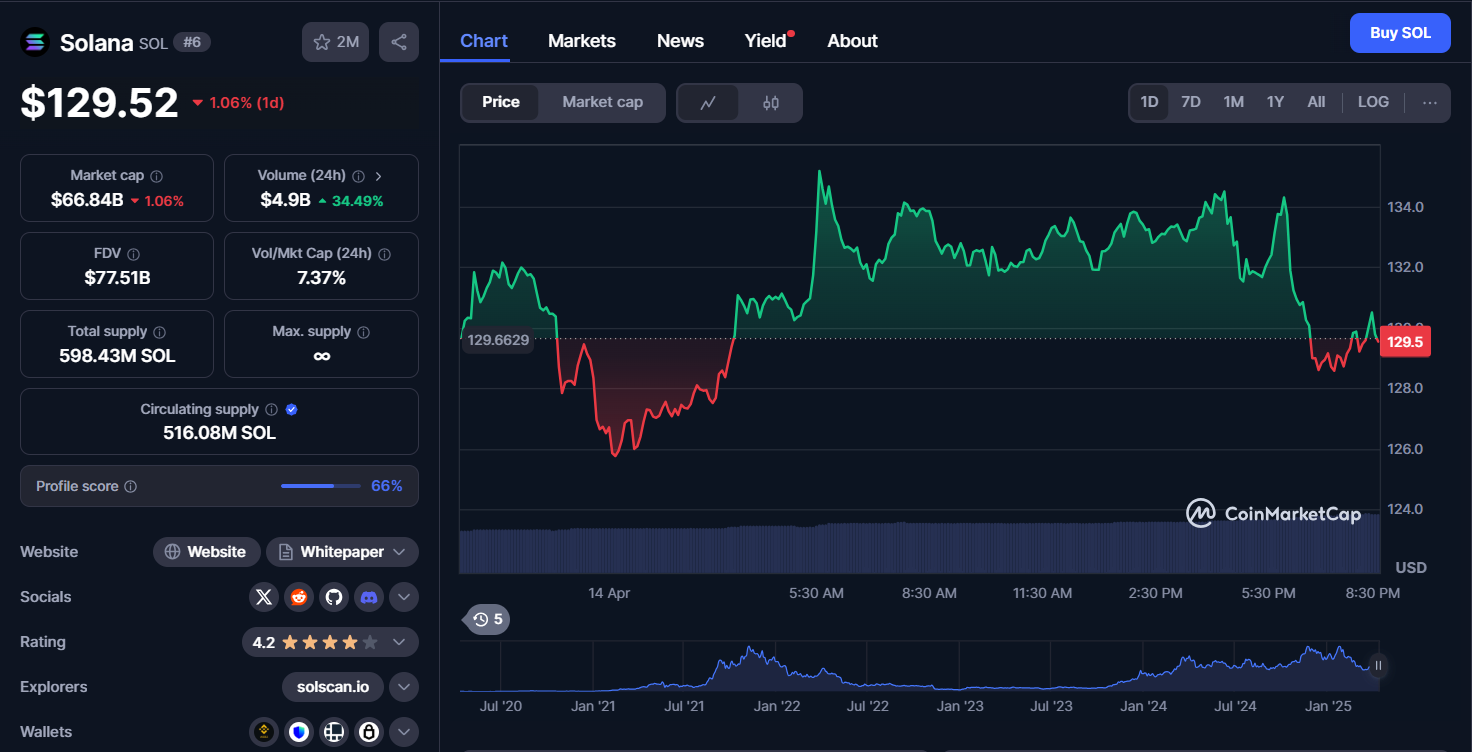
The circulating supply of Solana is 516.08 million SOL, which is part of its total supply of 598.43 million SOL. The token has an FDV (Fully Diluted Valuation) of $77.51 billion, and its 24-hour volume-to-market cap ratio is 7.37%, suggesting a relatively active market.
Solana has been ranging and oscillating in the past 24 hours. First, it moved up to $129.66 and then began a decline until now it is at $129.52. Considering the price action, it can be seen that there is a slight weight in the bears within the market. But this means that there is at least some level of investor attention since the volume is much higher compared to when the price was considerably high. Higher leverages of the broader index can give more understanding of its short-term movements
Furthermore, the Solana price has oscillated within the band of $125.52 – $134.58 over the past 24 hours. The highest value it has reached to date was on January 19, 2025, at $294.33; this is therefore down by 55.73% compared to the current values. The lowest price of Solana since its existence was found on May11 2020 at $0.5052, making the latest value an upsurge of 25,695.01%.


