- XRP has completed an inverse head-and-shoulders pattern, signaling a strong bullish breakout toward higher targets.
- RSI and MACD indicators show increasing buying pressure, reinforcing the bullish outlook.
- XRP’s market cap and trading volume surged, ranking it as the fourth-largest cryptocurrency globally.
XRP is stealing the spotlight in the crypto markets, igniting bullish excitement as it stages a powerful breakout and surges past key technical levels. It’s recent surge gains strength through its rising trading volume and multiple buy signal indicators, which indicate a prosperous time for its rally.
According to Ali, XRP has confirmed a classic inverse head-and-shoulders pattern on the 4-hour chart, suggesting a strong bullish breakout is underway. An analysis by Ali shows XRP currently displays a classic inverse head-and-shoulders pattern against Tether at the 4-hour interval that predicts this market will breakout favorably for bulls.
XRP formed its initial left shoulder in early April and created the head on April 7th before finishing the right shoulder by mid-April thus breaking through the resistance near $2.32 where it currently trades at $2.3377. Ali’s Fibonacci extension analysis shows that if bullish momentum continues, then it will move towards $2.45, $2.57, $2.75, or reach $2.91 as its final target.
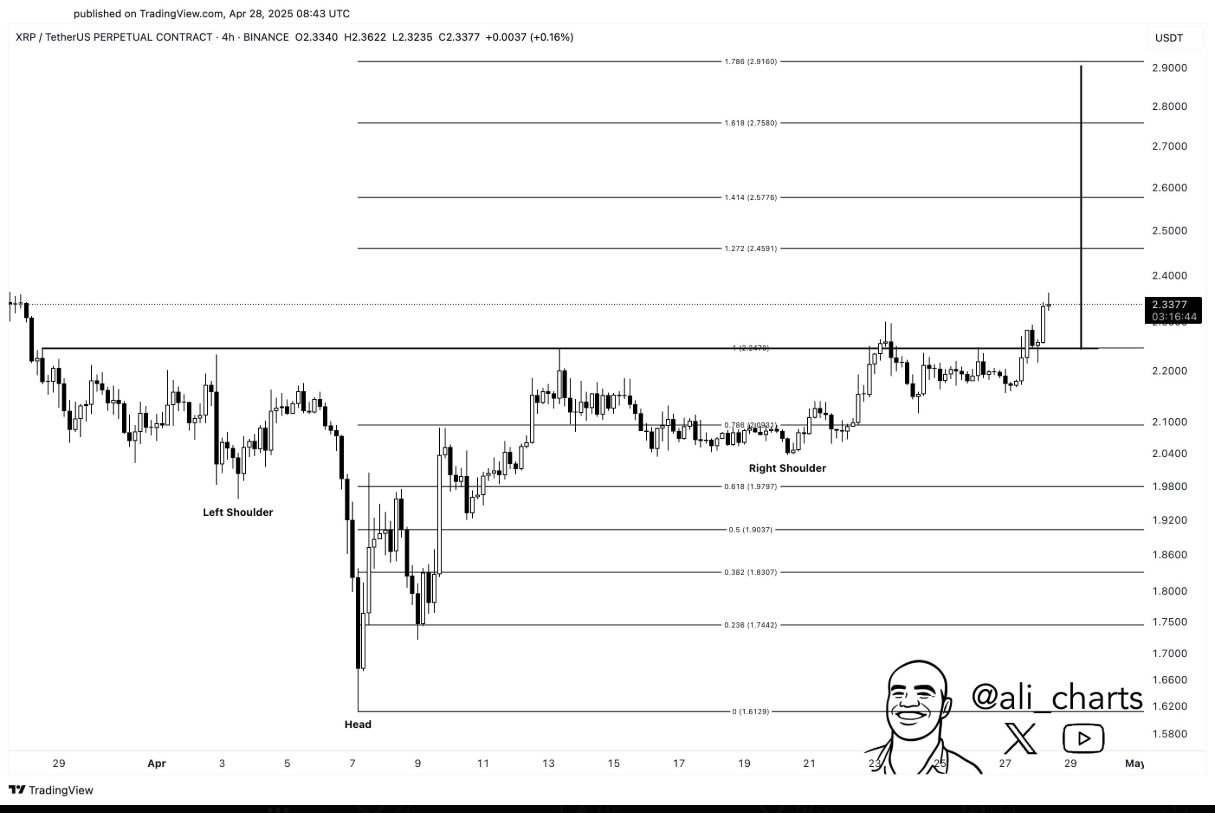
Source: X
Momentum Builds as XRP Trading Volume and Market Cap Surge
In today’s trading, XRP demonstrated strong positive momentum, rising by 2.20% over the past 24 hours to reach a price of $2.30. The rise in market capitalization reached $134.62 billion as 24-hour trading volume escalated dramatically by 65.93% to reach $4.7 billion. The total value based on FDV reaches $230.01 billion, and its circulating supply represents 58.44 billion units from a possible 100 billion. Throughout the day, it demonstrated rising price values before experiencing a surge after its brief overnight decrease. The bullish trend demonstrates growing investor confidence as it holds the position of fourth-leading cryptocurrency based on CoinMarketCap.
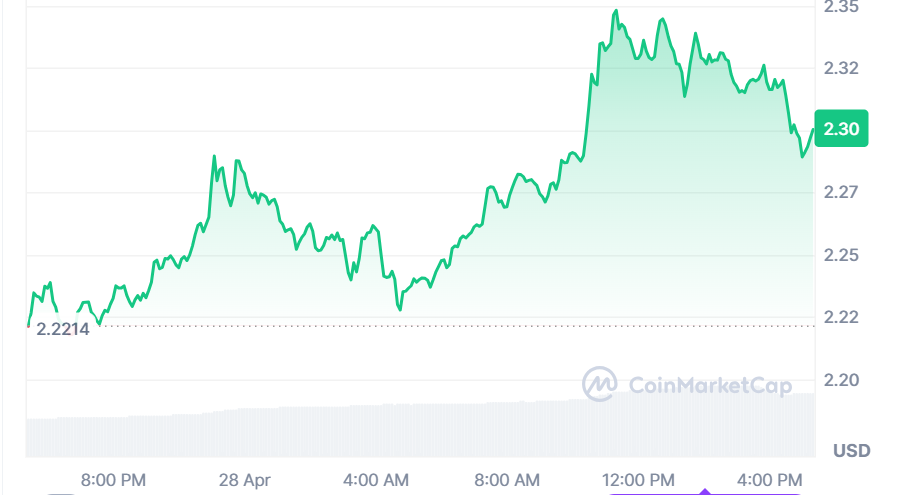
Source: CoinMarketCap
Technical Indicators Flash Bullish: XRP Eyes Higher Targets in May
Current technical indicators show a bullish sentiment increase because the Relative Strength Index (RSI) reached 60.97, which positions it in bullish terrain and demonstrates rising buying demand. The Moving Average Convergence Divergence indicator produces a bullish crossover because its MACD line crosses above the signal line, which continues to support upward momentum. Price and technical indicators keep rising steadily to show that market sentiment remains bullish for XRP while it approaches upcoming resistance zones during May.
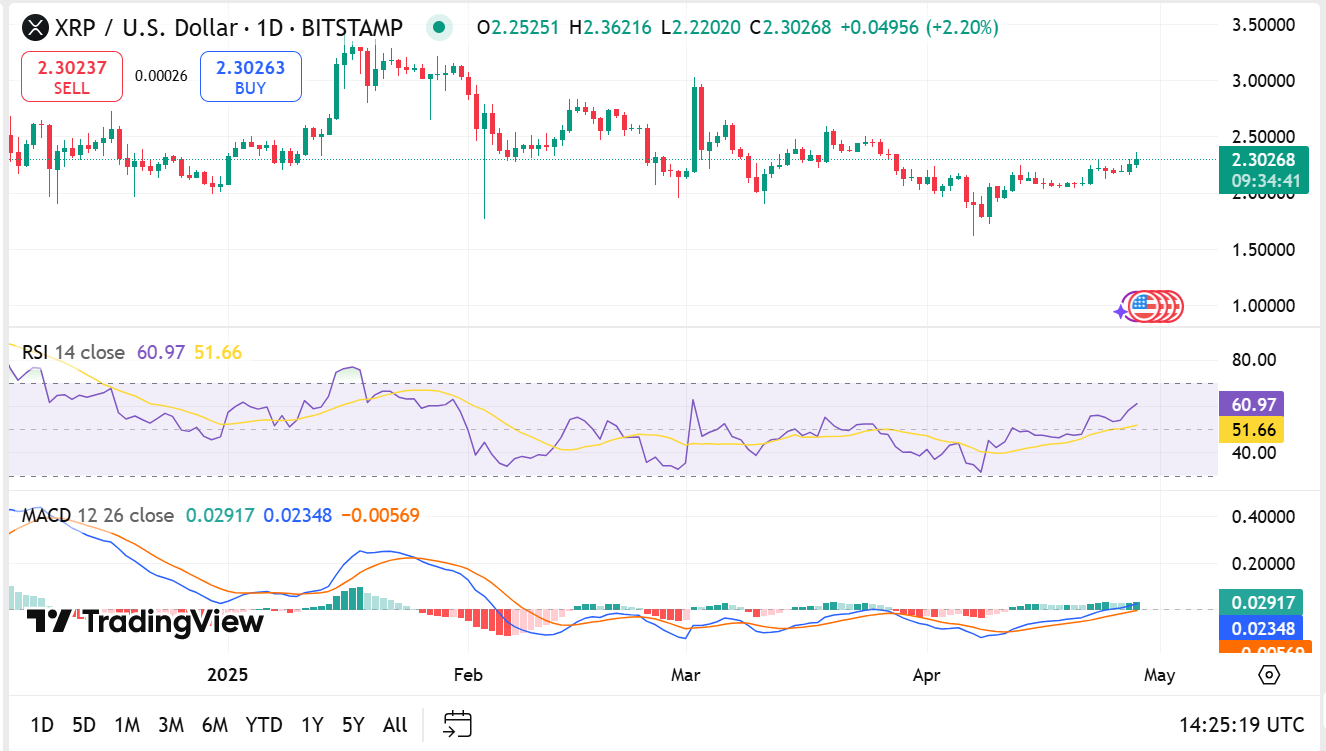
Source: TradingView


